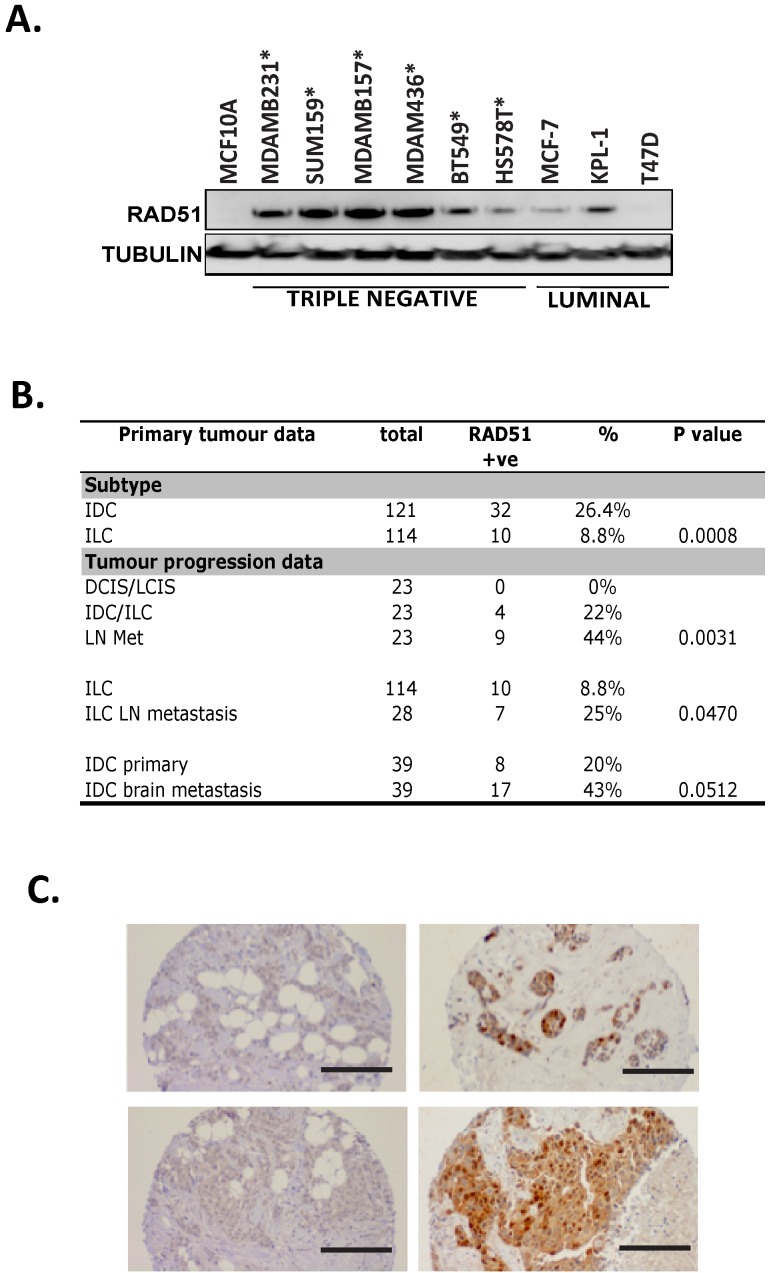
Figure 1. High RAD51 expression is observed in basal breast cell lines and metastatic patient samples.
(A) Ten breast cancer cell lines were analysed for RAD51 protein expression. Triple negative breast cancer lines are marked with an asterix. (B) 235 primary breast cancers were analysed by tissue microarray for RAD51 expression. P vales were obtained using Chi squared test with Yates correction (95% confidence interval) and Fisher's exact test to compare RAD51 status between defined subgroups of samples. (C) Histological comparison of RAD51 expression shows high levels in metastatic lymph node tissue samples (right panels) compared to matched primary breast tumor (left panels −100X magnification, bar 50µm).

