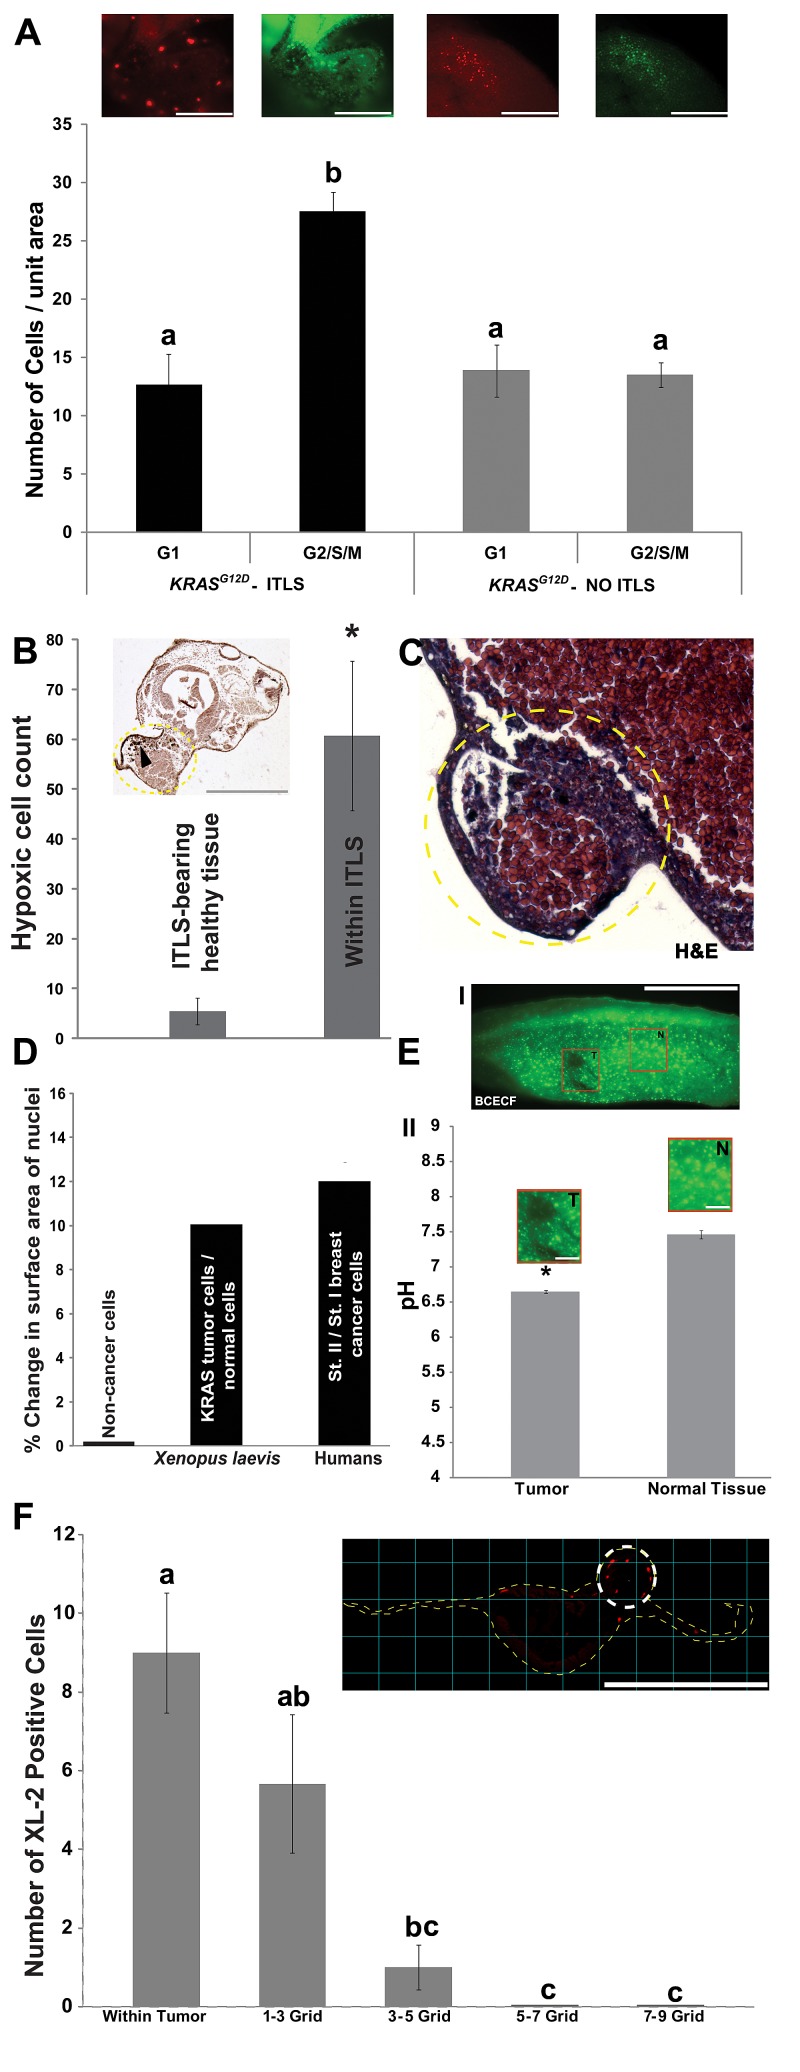
Figure 1. Induced tumor-like structures (ITLS) exhibit characteristics reminiscent of human tumors.
(A) Rates of proliferation were analyzed in vivo in fluorescent cell cycle indicators (FUCCI pair: mKO2-zCdt1 and mAG-zGeminin) injected, ITLS-bearing embryos at stage 34. ITLS regions (black bars) have >65% more cells that are in G2/S/M phase (green insert, mAG-zGeminin) than there are in G1 phase (red insert, mKO2-zCdt1). Unperturbed regions (grey bars) showed no difference between the number of cells in G1 (red insert) and G2/S/M (green insert) phases. N=8 for all four categories. P<0.001, one-way ANOVA, tukey's post hoc analysis; different letters indicate statistically significant difference; scale bar = 250 µm.(B) Immunoperoxidase analysis of hypoxia using detection of pimonidazole protein adducts (black arrowhead) in cells reveals a 12 fold increase for immunoperoxidase staining for hypoxia per unit area in ITLS (yellow traces) than in surrounding healthy tissue. N=7; *P<0.0001 Student's t-test; scale bar = 500 µm.(C) H&E staining of KRASG12D ITLS sections (yellow circular trace, 40X) for evidence of features of neoplasia reveals disorganized growth patterns, including misplaced mesodermal and endodermal cells, and mesodermal cells that are larger than those present in unperturbed regions. (D) Automated analysis of the size of Hoechst Blue stained nuclei reveals a 10% increase in the size of tumor nuclei compared to nuclei from unaffected cells. A change in morpholology of the nuclei that includes a progressive increase in nucleus size has been documented in human breast cancer cells [82]. N=16 (2371 nuclei) for both ITLS and unaffected regions.(E) Intracellular pH measurements in ITLS and Control regions were made using the fluorescent pH reporter dye BCECF. (I) A decreased fluorescence is observed in ITLS cells (T) compared to a normal region (N). (II) Upon quantification, levels of fluorescence correspond to pH values of 6.6 in ITLS and 7.41 in control regions. N=8 for both treatments; *P<0.05 Student's t-test; scale bar = 1mm in tail fragment; 150 µm in magnified inserts.(F) The response of innate immunity to ITLS formation was investigated using anti-XL2 immunohistochemistry to mark the presence of leukocytes: leukocytes are primarily present around ITLS (white circular trace) and 1-3 grid (300 µM) away from ITLSs. N=12; P<0.01, one-way ANOVA, Tukey's post hoc analysis; different letters indicate statistically significant difference; scale bar = 500 µm. Error bars indicate ± 1 s.e.m in A, B, E, F.

