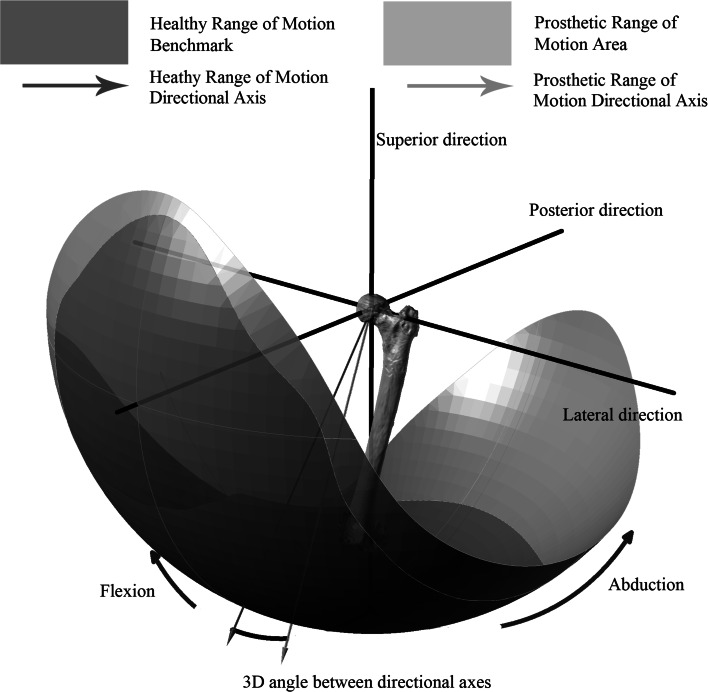
Fig. 2.
Comparison of the prosthetic motion area (purple) against a healthy range of motion benchmark (gold). Position of prosthetic motion area evaluated at the three-dimensional angle between its directional axis (purple) and the directional axis of healthy range of motion benchmark (red) (colour figure online)

