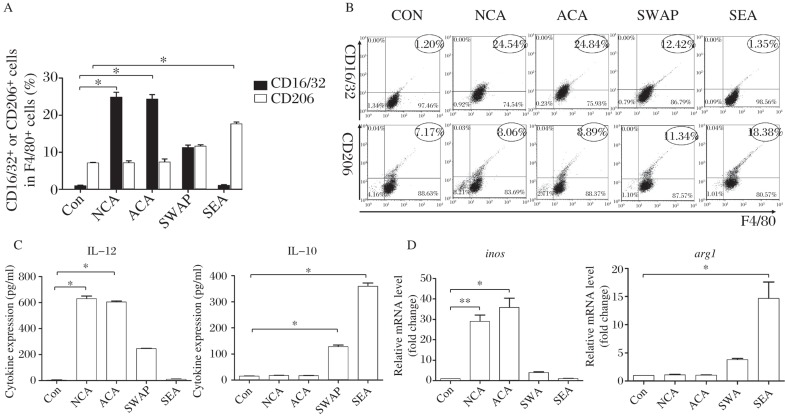
Fig. 2. Different antigens of S. japonicum induced Mφ polarization.
A and B: Percentage of CD16/32+ or CD206+ cells among F4/80+ cells determined by FACS after NCA, ACA, SWAP and SEA (antigens from different stages of S. japonicum) stimulation compared with unstimulated cells as ( ∗P < 0.01). C: IL-12 and IL-10 cytokine levels in the supernatant of RAW264.7 cultures by ELISA after NCA, ACA, SWAP and SEA stimulation compared with unstimulated cells (∗P < 0.01). D: Relative transcription level of inos and arg1 level in RAW264.7 by RT-PCR after NCA, ACA, SWAP and SEA stimulation compared with unstimulated cells (∗P < 0.01). The results are shown as mean of three independent experiments.

