

Abstract
The aim of this study was to evaluate the efficacy of mosaicplasty with tissue-engineered cartilage for the treatment of osteochondral defects in a pig model with advanced MR technique. Eight adolescent miniature pigs were used. The right knee underwent mosaicplasty with tissue-engineered cartilage for treatment of focal osteochondral defects, while the left knee was repaired via single mosaicplasty as controls. At 6, 12, 18 and 26 weeks after surgery, repair tissue was evaluated by magnetic resonance imaging (MRI) with the cartilage repair tissue (MOCART) scoring system and T2 mapping. Then, the results of MRI for 26 weeks were compared with findings of macroscopic and histologic studies. The MOCART scores showed that the repaired tissue of the tissue-engineered cartilage group was statistically better than that of controls (P < 0.001). A significant correlation was found between macroscopic and MOCART scores (P < 0.001). Comparable mean T2 values were found between adjacent cartilage and repair tissue in the experimental group (P > 0.05). For zonal T2 value evaluation, there were no significant zonal T2 differences for repair tissue in controls (P > 0.05). For the experimental group, zonal T2 variation was found in repair tissue (P < 0.05). MRI, macroscopy and histology showed better repair results and bony incorporation in mosaicplasty with the tissue-engineered cartilage group than those of the single mosaicplasty group. Mosaicplasty with the tissue-engineered cartilage is a promising approach to repair osteochodndral defects. Morphological MRI and T2 mapping provide a non-invasive method for monitoring the maturation and integration of cartilage repair tissue in vivo.
Keywords: cartilage repair, mosaicplasty, tissue engineering, magnetic resonance imaging, T2 mapping
INTRODUCTION
Articular cartilage injury is one of the most common injuries seen in orthopaedic surgery, especially in young athletes. In a retrospective review of 31,510 knee arthroscopies, the incidence of chondral lesions was 63%[1]. Full-thickness articular cartilage lesions with exposed bone were found in 20% of patients, with 5% in those younger than 40 years old[1]. Deep chondral defects in a weight-bearing area are at high risk of progressing to osteoarthritis (OA), a process accelerated in young and active individuals[2]. Treatment of focal chondral injuries of the knee remains challenging and controversial as the cartilage does not spontaneously repair. Various surgical options have been developed to restore articular cartilage and produce a durable repair[3]; however, these traditional techniques have had limited success. Most of these procedures lead to the formation of fibrous or fibrocartilage tissue with poor biomechanical and biochemical properties compared to hyaline cartilage[4].
Recently, new techniques such as autologous osteochondral transplantation (AOT, mosaicplasty), autologous chondrocyte implantation (ACI), and tissue engineering models (matrix-associated autologous chondrocyte implantation-MACI) have been developed to treat full-thickness cartilage defects located in weight-bearing regions to create a hyaline or hyaline-like cartilage repair tissue[5]-[9]. Mosaicplasty has been used for more than a decade in clinical practice with successful results[5],[10],[11]. Mosaicplasty involves transfer of cylindrical osteochondral plugs from a non-weight-bearing area of the knee to the defective site in the form of a mosaic. Advantages include the simplicity of one-stage surgical procedure, low morbidity and cost, and a better clinical outcome[5],[12]. However, mosaicplasty also has its disadvantages, such as limited donor cartilage, different thickness and mechanical properties of donor and recipient cartilage, subsidence of graft surface, and poor integration of remnant defect[13]-[14]. The resolution of these issues, especially integration of remnant defect between plugs, is crucial in advancing mosaicplasty as a cartilage repair technique. As tissue engineering is promising for the future of cartilage repair7-[9],[15], mosaicplasty may improve osteochondral repair options. However, their outcomes remain unknown.
As articular cartilage repair techniques are increasingly used in clinical practice, methods to assess repair tissue will become increasingly important. Arthroscopy is unsuitable for routine follow-up due to its invasiveness and potential morbidity. In contrast, magnetic resonance imaging (MRI) is a noninvasive method that can provide a more global assessment of the entire repair area, longitudinally at different time points. Additionally, the biochemical properties of the cartilage can be evaluated with newer MRI techniques[7]-[10]. T2 mapping, a new quantitative technique of MRI, provides information about the interaction of water molecules and collagen network within the articular cartilage[16]. It is becoming more popular for the evaluation of cartilage repair. In both animal and human studies, T2 mapping has been shown to differentiate the hyaline cartilage from the fibrocartilage after cartilage repair[7],[17].
We designed a new technique, mosaicplasty with tissue-engineered cartilage, to repair full-thickness osteochondral defects in a pig model. By using a pig model of near equivalent size, anatomy, mechanical loading of the joint and the cartilage and composition as a human subject, our model can be easily transferred to clinical practice. MRI morphology data was obtained 26 weeks postoperatively and compared with macroscopic and histologic findings. We aimed to observe the maturation of cartilage repair tissue after our procedure and evaluate its efficacy by 3.0T-MRI with morphological scoring and in vivo biochemical T2 mapping.
MATERIALS AND METHODS
Animals
Eight adolescent miniature pigs (5 months old, male to female ratio of 1:1, weighing 25 kg) were utilized for this study. The study protocol was approved by the local institutional review board at the authors' affiliated institutions. Animal welfare and the experimental procedures were carried out strictly in accordance with the Guide for Care and Use of Laboratory Animals (National Research Council of USA, 1996).
Formation of tissue engineered cartilage
Both knees of each pig were performed by the same operating procedure. Small slices of articular cartilage were harvested from non-weight bearing sites. Chondrocytes were isolated and cultured. Scaffolds of polylactic-co-glycolic acid (PLGA; PLA:PGA, 9:1; AUVON, USA) were immersed in polylysine and sterilized with ethylene oxide. Chondrocytes of the second passage were seeded into the PLGA scaffolds by pipetting directly and repeatedly at a density of 2×10⁶ cells/mL. Then, they were cultured in a bioreactor (HFB-40, Celdyne, Houston, TX, USA) containing DMEM/F12 (Gibco, Carlsbad, CA, USA) for 4 weeks to form tissue engineered cartilage for implantation.
Surgical procedure
After 8 weeks, a standardized full-thickness defect (diameter: 6 mm; depth: 6 mm)[1]-[3] was created in the weight-bearing area of the femoral medial condyle of both knees by using a hollowed drill (Fig. 1A). The defects were repaired firstly by autologous osteochondral mosaicplasty. Four autologous osteochondral plugs (diameter: 3 mm) harvested from the non-weight bearing area of the distal femur were implanted into the defect. The right knees were assigned to the experimental group while the left knees served as the control group (8 knees in each group). The dead spaces between plugs were treated as follows: in the control group, dead spaces were left empty (Fig. 1B) while in the experimental group, in vitro tissue-engineered cartilage was performed to fill the dead spaces (Fig. 1C). Animals began full weight bearing within a very short period of time postoperatively and then were allowed to return to outdoor farm when they regained their normal gait.
Fig. 1. Implantation surgery.
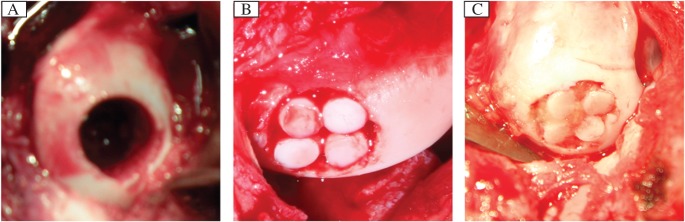
A: A full-thickness defect (diameter, 6 mm; depth, 6 mm) was created in the weight-bearing area of the medial femoral condyle of the femur of pigs. B: Control group: The defect was repaired by single mosaicplasty. C: Experimental group: The defect was repaired by mosaicplasty with tissue engineered cartilage. The dead space among plugs were filled with the tissue-engineered cartilage.
MRI evaluation
In vivo, repair tissues were longitudinally assessed 6, 12 and 18 weeks postoperatively with 3T-MRI. Pigs were anesthetized with intramuscular ketamine (12 mg/kg) and midazolam (1 mg/kg) before MRI. They were sacrificed 26 weeks postoperatively with a lethal dose of intravenous pentobarbitone. Knees were harvested en bloc with intact capsule and surrounding muscles for the final MRI, after which each specimen was sectioned into halves corresponding as closely as possible to the MRI sagittal plane. Specimens were then submitted for macroscopic and histologic assessment.
Image acquisition
MRI was performed on a 3T MR system (Magnetom Trio, A Tim system, Siemens, Erlangen, Germany) with a dedicated 8-channel knee coil. Each pig was placed feet-first in the prone position in the middle of the coil. T2 relaxation times were obtained from T2-maps reconstructed using a multiple spin echo technique with a repetition time (TR) of 1200 milliseconds. Six echo times (TE) were collected (13.8, 27.6, 41.4, 55.2 and 69 milliseconds). A 16 cm× 16 cm field of view (FOV), 2 mm slice thickness, distance factor of 10% and bandwidth of 228 Hz/pixel were used. Sixteen slices were measured for each pig knee. Images were acquired in the sagittal plane for the medial condyles. Scan time was 4 minutes 36 seconds.
For morphologic evaluation, a standard knee protocol was used for all animals, consisting of a sagittal PD-weighted image with fat suppression (TR: 3600 ms; TE: 17 ms) and a coronary T1WI (TR: 765 ms; TE: 16 ms) as well as a T2WI with fat suppression sequence (TR: 4000 ms; TE: 48 ms) in the sagittal and coronary planes. All sequences were obtained with the following parameters, including FOV of 16 cm× 16 cm and section thickness of 2 mm, 16 slices, distance factor of 10% and bandwidth of 228 Hz/pixel. The total acquisition time for morphologic sequences was 5 minutes 17 seconds.
Data analysis
To evaluate the morphologic condition of cartilage repair tissue and surrounding cartilage by using routine sequences, we used the MR observation of cartilage repair tissue (MOCART) scoring system[18]. The maximum score achievable in the evaluation of 9 variables (the degree of defect repair, the integration of cartilage repair tissue to the border zone, the surface and structure of cartilage repair tissue, signal intensity, the constitution of the subchondral lamina and bone, possible adhesions and effusion) was 100. Two experienced musculoskeletal radiologists assessed and reviewed the images. A representative score for each parameter was determined by averaging the scores of the two observers.
The T2 maps were post-processed by using workstation software (Syngo acquisition workplace, Siemens Medical, Erlangen, Germany). Morphologic images provided by the conventional sequences in combination with the slices of cartilage repair tissue sites were selected on T2 images. In each slice, two regions of interest (ROIs) were defined. One ROI, encircling the repair site, was marked with black arrows, and one ROI placed on adjacent normal cartilage in the same slice was used as reference cartilage (white arrow) (Fig. 2B, D, F, H, J, I, N and P). ROIs were analyzed as mean ROIs (from the subchondral bone to the cartilage surface with identified cartilage repair sites) and zonal ROIs (dividing the global thickness of cartilage repair tissue and reference cartilage into equal-sized deep and superficial aspects). In all knees, cartilage repair sites were observed over 2 to 3 contiguous sagittal sections and ROIs were placed within repair tissue per section. Thus, a total of 4 to 6 ROIs were measured within each cartilage repair site. Control cartilage sites were also chosen from the same zone surface, but were required to be more than 2 cm away from cartilage repair tissue. T2 maps were then fused on the corresponding anatomic images utilizing workstation fusion software. Sample T2 maps with ROIs positioned are shown in Fig. 2B, D, F, H, J, I, N and P.
Fig. 2. Sagittal T2WI-FS (A, C, E, G, I, K, M, O) and corresponding fusing T2 maps (B, D, F, H, J, L, N, P) appearance of the repaired tissue (between the black arrows) and the adjacent normal cartilage (white arrows) in the control group (A, B, E, F, I, J, M, N) and the experimental group (C, D, G, H, K, L, O, P) at 6 weeks (A-D), 12 weeks (E-H), 18 weeks (I-L) and 26 weeks (M-P) after surgery.

Macroscopic and histologic analysis
Harvested samples were initially examined macroscopically. The longitudinal cross-section of defects was studied, as well as the interface between repaired tissue and adjacent normal osteochondral tissue. The repaired cartilage was macroscopically scored by using a previously developed scale[19]. After macroscopic analysis, samples were submitted for histologic and immunohistochemical staining.
The cartilage tissue blocks were fixed with 10% formalin and further processed for histology. Specimens were decalcified for 1 month, dehydrated and embedded in paraffin. Five μm sections were cut transversely with a microtome and hydrated in graded ethanol series. Repair tissue and normal cartilage sections were stained with H&E to evaluate the structural features of repair tissue, and with immunohistochemical staining to study collagen content.
Statistical analysis
Continuous variables were presented as mean ± standard deviation. Differences among the mean T2 values and macroscopic grading in both groups were analyzed by Student's t-test. Considering the multiple measurements of each pig, a two-way ANOVA with post-hoc test was also performed. Bivariate Pearson correlation analysis was performed to determine the correlation between MOCART scores and gross scores. All analyses were performed using the SPSS software (version 16.0, SPSS Inc., Chicago, IL, USA). P-value of less than 0.05 was considered statistically significant.
RESULTS
All 8 pigs survived during the study period. No postoperative wound inflammation, infection, swelling or other complications were observed.
Morphologic results
According to the MOCART scoring system, the experimental group scores were statistically higher than those of controls (P < 0.001; Fig. 2, Fig. 3). A significant increase in MOCART scores over time was also found in both groups, especially in the experimental group. By individually considering the 9 variables, significant differences were found from the integration of the border zone, surface and signal intensity of repair tissue at 26 weeks (P < 0.05). Defect repair in the experimental group was better than controls. In the experimental group, the integration of the border zone was nearly complete, repair area surfaces were smooth and continuous, and a gradual decrease of graft signal intensity was found over time (Fig. 2O). However, fluid signal clefts, irregular surface, inhomogeneous signal and cyst formation in repair tissue were found in the control group (Fig. 2M).
Fig. 3. MOCART scores between the control group (CG) and the experimental group (EG) at different follow-up intervals.

*P<0.05, vs CG.
Mean (full-thickness) T2 values
T2 values (milliseconds) are shown in Table 1. The adjacent normal cartilage showed comparable T2 values in the two groups at different follow-up intervals (P > 0.05) (Fig. 4). Concerning cartilage repair tissue, T2 values in controls were slightly, though not significantly, higher than those of the experimental group at 6 and 12 weeks postoperatively (P = 0.86, P = 0.581, respectively; Fig. 2B, D, F and H). However, at 18 and 26 weeks, the mean T2 values of repair tissue in the experimental group were significantly lower compared with controls (P = 0.005 and P = 0.002, respectively; Fig. 2J, L, N and P). The mean T2 values of repair tissue in both groups decreased over time, and were most obvious in the experimental group (Fig. 4). When comparing adjacent normal cartilage and repair tissue in the experimental group, we found that mean T2 values for repair tissue were significantly higher than those of adjacent normal cartilage at 6 and 12 weeks postoperatively (P < 0.001). However, comparable results were found for both adjacent cartilage and repair tissue at 18 and 26 weeks (P = 0.124 and P = 0.375, respectively). In the control group, mean T2 values for repair tissue were significantly higher than those of adjacent normal cartilage (P < 0.05). At the interface of plugs with native cartilage, there were regions of prolonged T2 relaxation time for the control group (Fig. 2N).
Table 1. Mean and zonal T2 values (milliseconds) for cartilage repair tissue (RT) and adjacent normal cartilage (NC) of two groups according to postoperative follow-up intervals.
| Group | Time point (weeks) | Subgroup | Mean T2 (milliseconds) | Deep T2 (milliseconds) | Superficial T2 (milliseconds) |
| CG | 6 | RT | 69.13±4.36 a | 69.06±4.26 | 69.23±4.53 |
| NC | 50.90±1.96 a | 49.00±2.03 | 52.80±2.00 | ||
| 12 | RT | 65.30±4.61 a | 64.89±4.61 | 65.71±4.65 | |
| NC | 52.75±1.84 a | 51.56±1.92 | 53.94± 1.78 | ||
| 18 | RT | 60.06±3.06 b | 59.23±3.05 | 60.91±3.09 | |
| NC | 53.90±1.98 a | 52.49±2.15 | 55.31±1.98 | ||
| 26 | RT | 57.20±2.67 b | 56.46±2.74 | 58.06±2.60 | |
| NC | 53.78±1.99 a | 52.35±2.06 | 55.25±2.01 | ||
| EG | 6 | RT | 68.75±4.27 a | 68.61±4.24 | 69.26±4.26 |
| NC | 50.99±2.35 a | 49.35±2.70 | 52.61±2.08 | ||
| 12 | RT | 64.18±3.23 a | 63.53±3.56 | 64.94±3.02 | |
| NC | 52.63±1.45 a | 51.38±1.30 | 53.89±1.63 | ||
| 18 | RT | 55.58±2.31 b | 54.16±2.45 | 56.98±2.23 | |
| NC | 53.91±1.70 a | 52.58±1.80 | 55.29±1.76 | ||
| 26 | RT | 52.34±2.43 b | 50.80±2.52 | 53.83±2.45 | |
| NC | 53.31±1.77 a | 51.96±1.70 | 54.66±1.92 |
Note—CG = the control group; EG = the experimental group; Each data represents the mean and standard deviation. a No significant difference in mean T2 values between NC and RT (P>0.05), b Significant difference in mean T2 values between NC and RT (P<0.05).
Fig. 4. Mean (full-thickness) T2 values (milliseconds) of the repair tissue (RT) and adjacent normal cartilage (NC) for the control group (CG) and the experimental group (EG) at different follow-up intervals.

NC showed comparable T2 values for two groups at any follow-up interval. Mean T2 values of RT for two groups showed a decreased trend over time. This decreased trend, however, was most obvious in EG. Comparable mean T2 values were found for NC and RT at 18 and 26 weeks in EG. But for CG, mean T2 values of RT were significantly higher than that of NC at either follow-up time point.
Zonal T2 values
The evaluation of zonal T2 value of adjacent normal cartilage sites showed a significant increase between the deep and superficial layers of articular cartilage at various postoperative follow-up intervals (P < 0.05; Fig. 5). By evaluating cartilage repair tissue, there were no significant differences for zonal T2 values within the control group at any time point (P > 0.05; Fig. 5A). However, the repair tissues in the experimental group showed varying results with regard to zonal assessment at different periods after implantation. Zonal variation could not be found in repair tissue at 6 and 12 weeks (P > 0.05). However, at 18 and 26 weeks, repair tissues in the experimental group showed a significant zonal increase from deep to superficial layers (P < 0.05; Fig. 5B). Table 1 illustrates the results for cartilage repair tissue in the two groups.
Fig. 5. Zonal (deep and superficial) T2 values (milliseconds) of the repair tissue (RT) and adjacent normal cartilage (NC) for the control group (A) and the experimental group (B) at different follow-up intervals.

*P<0.05.
Macroscopic findings
After 26 weeks post-implantation, cartilage autografts in both groups survived in situ, without rising, descending or becoming detached. The integration of the subchondral bone and native bone was good. In the experimental group, gaps among the plugs were replaced by neo-cartilage hyaline cartilage, which appeared macroscopically similar to host cartilage. The neo-cartilage surface was as smooth and congruous as native articular cartilage. According to their cross-sectional appearance, the regenerated cartilage macroscopically appeared similar to host cartilage with good integration. No fissuring was noted (Fig. 6C). However, in the control group, the zone of dead spaces was covered by just a thin layer of fibrous tissue. According to cross-sectional appearance, the surface of fibrous tissue was lower than that of adjacent cartilage, making the entire reconstructed articular surface rough. Integration in interface was poor (Fig. 6F). The corresponding macroscopic grading of all knees in the both groups is shown in Table 2. Furthermore, there was a significant correlation between MOCART scores and macroscopic scores (r = 0.970, P < 0.001).
Fig. 6. Histological and immunohistochemical analyses and gross cross-sectional appearance of the repaired cartilage at 26 weeks after surgery.

A and D: H&E staining (×100). B and E: immunohistochemical staining for collagen II (×100). C and F: Gross cross-sectional appearance. A-C: In the experimental group, defects were repaired by hyaline or hyaline-like cartilage, which was almost completely integrated into surrounding normal cartilage. D-F: In the control group, the surface of repair tissue was not smooth. The zones of dead spaces had visible fissures and were filled with fibrous tissue which stained negatively for type II collagen.
Table 2. Results of grading scale for gross appearance.
| Grading | CG | EG | P |
| Coverage | 2.63±0.74 | 3.63±0.52 | 0.008 |
| Neocartilage color | 2.50±0.76 | 3.50±0.53 | 0.009 |
| Defect margins | 1.75±0.71 | 3.25±0.46 | 0.000 |
| Surface | 2.13±0.83 | 3.37±0.52 | 0.003 |
| Total | 9.00±2.00 | 13.75±1.75 | 0.000 |
CG: the control group; EG: the experimental group. Each data represents the mean ± standard deviation.
Histologic results
After 26 weeks, PLGA scaffold was completely resorbed. The autologous cartilage from mosaicplasty survived and was observed in situ. The subchondral bone was healed with good integration. Type II collagen staining of the auto-transplanted cartilage was nearly normal in the two groups. In the experimental group, the zones of dead spaces in all defects were covered by hyaline-like cartilage. The reconstructed articular surface was smooth and uniform with better contiguity to native cartilage (Fig. 6A). Collagen II in the repaired tissue was evident (Fig. 6B). In the control group, dead spaces in all defects failed to regenerate hyaline cartilage. Only a small amount of fibrous tissue was observed (Fig. 6D). Type II collagen staining presented negative staining (Fig. 6E). The surface of fibrous tissue was lower than that of native cartilage, making the surface rough. Visible fissures were found in the cartilage layer. Sclerotic subchondral bone was also found.
DISCUSSION
The full-thickness defects of articular cartilage caused by trauma or joint diseases are common in orthopaedic practice. Regeneration cartilage is poor due to the absence of neurovascular supply; hence, the treatment of articular cartilage injury remains a challenge for varying outcomes. Focusing on the development of reliable approaches to restore joint congruency with hyaline cartilage and to integrate this neo-cartilage with surrounding host cartilage is a priority. Current approaches used in clinical practice are mosaicplasty, ACI and tissue engineering techniques such as MACI5-[13],[17].
Compared with other methods, mosaicplasty provides better outcomes[10],[11]. It can immediately fill focal osteochondral defects with mature intact hyaline cartilage. The major advantages of mosaicplasty are the convenience of one step procedure, relatively brief rehabilitation period and low cost[5],[12]. However, some problems associated with mosaicplasty include limited donor cartilage, dead spaces between cylindrical grafts and the lack of integration of donor and recipient hyaline cartilage, subsequent cyst formation and uneven surface[13]. Some studies[6],[14] have demonstrated that these implants would deteriorate over time as a result of the lack of integration and formation of fibrocartilage between host and donor cartilage. Persistent gaps might make pressure conduction abnormal, which causes cartilage degeneration over time. In our study, we also found that the congruency of joint surface could not be restored to its original status in single mosaicplasty due to the dead space between cylindrical grafts. Thus, we aimed to design a model that would improve single mosaicplasty procedure and outcome.
Tissue engineering approaches that use 3D biomaterial scaffolds seeded with chondrocytes as carriers for cell growth are popular areas for research. One advantage may be more efficient redifferentiation of chondrocytes, and hence the formation of hyaline-like repair tissue. Tissue engineering is a promising strategy for cartilage repair and has been successful in preliminary studies8-[9],[15],[20]. Tissue engineered cartilage has shown to be successful in repairing cartilage defect in a large animal model[20]. In contrast to other repair methods, tissue engineered cartilage has demonstrated improved integration with surrounding cartilage in vitro[21],[22]. Sun et al.[23] demonstrated that tissue engineering technique may solve poor concrescence of remnant defect and the integration of single mosaicplasty in a goat model. Thus, engineered cartilage has the potential to overcome the limitations of poor integration in single mosaicplasty. In our study, autologous chodrocytes were seeded on a 3D scaffold and cultured in vitro to form tissue engineered cartilage. This engineered cartilage was histologically demonstrated to be hyaline-like, forming a highly organized collagen structure similar to native cartilage.
Monitoring graft characteristics is increasingly important to assure a good outcome, and to prevent cartilage degeneration that eventually leads to osteoarthritis. MRI permits noninvasive and direct assessment of cartilage defects and can dynamically monitor the progression of cartilage repair. In addition, newer MR sequences, such as T2 mapping, can show major the ultrastructural components of cartilage[16]. The quantitative measures of T2 relaxation time of repair tissue may therefore be useful in the assessment and long-term follow-up of MACT or OAT repairs, with regards to gradual maturation, native differentiation and integration[24].
In mosaicplasty, the integration with MR assessment has posed continuous challenges. Link et al.[25] found that 15% of patients had an incongruity of cartilage-cartilage interface, although the results of the cartilage repair were satisfactory. In an indirect MR arthrography study after OAT, persistent fissure-like gaps between implanted cartilage and native cartilage were demonstrated[26]. After single ostochondral autograft and allograft implantation for the treatment of isolated grade IV osteochondral defects in a canine model, Glenn et al.[27] reported that a persistent cleft was noted at the interface of the articular surfaces of graft and host in 90% of all histologic specimens 6 months postoperatively. The remaining 10% of knees filled clefts with fibrous tissue (comparable to our results). We also found that the dead space between grafts after mosaicplasty did not become completely integrated.
For the optimal use of MRI in the evaluation of tissue repair, a simple evaluation and point scoring system that allows efficient statistical data analysis is necessary. The MOCART score has been designed to systematically describe the constitution of the area of cartilage repair and surrounding tissues, and shown to be reliable and reproducible, and can be applied to different surgical cartilage repair techniques[28]. The system is very helpful for longitudinal follow-up of cartilage repair.
Based on the use of MOCART score after MACI, Trattnig et al.[29] reported that in longitudinal follow-up after 12, 24 and 52 weeks, there was an increase in the overall MOCART score from 53 to 63, and to 73, after 12, 24 and 52 weeks. This increase in trend for the overall MOCART score was also found in our study. It may possibly reflect a gradually improved regeneration process for tissue repair over time. At 26 weeks, MOCART score in the experimental group (77.50 ± 6.55) was obviously higher than that of controls (59.37 ± 6.78). In the control group, the congruency of joint surface was unable to be restored to its original status, even up to 26 weeks. Fluid signal clefts at the interface between graft tissue and native cartilage indicated poor graft integration. Inhomogeneous signal and cyst formation in the repair tissue of controls could be seen on T2WI with fat suppression. Cyst formation was associated with edema-like signal intensity and also demonstrated a fibrocartilage or fibrous tissue appearance[30]. The inhomogeneous signal within graft cartilage may have been due to volume averaging of developing fibrous tissue, or possibly fluid within the interstices between plugs.
In the experimental group, the integration of border zone was nearly complete. Continuous smoothing of the graft surface was observed. A gradual decrease in graft signal intensity was found over time. These findings may be related to graft integration and remodeling.
Our results demonstrated a strong correlation between MOCART scores and macroscopic scores. Therefore, we believe that mosaicplasty with tissue engineered cartilage may solve the problem of poor integration found with single mosaicplasty, and that morphological MR can assess the maturation and integration process of repair tissue.
For the gaps between transplanted cartilage plugs and native cartilage, the length of postoperative period should be considered, as surface congruity will improve over time due to fibrocartilage tissue formation between osteochondral plugs. However, fibrocartilage repair tissue, or fibrous tissue, lacks the properties of hyaline cartilage for optimal joint function. It is critical to understand the biochemical constitution of repair tissue and this can be accomplished by using biochemical T2 mapping techniques.
Several studies have demonstrated the validity of T2 mapping for the assessment of articular cartilage and cartilage repair tissue7-[10],[17],[24]. T2 relaxation times allow for the evaluation of the major matrix components of cartilage such as water concentration, collagen architecture and orientation. An increased cartilage full-thickness T2 value is associated with early cartilage injuries[16]. Furthermore, the spatial distribution of T2 values can be used for in vivo monitoring of the biomechanical properties and maturation changes of various cartilage layers[31].
Many factors have an effect on T2 values, so that T2 values show an individual variability. In our study, we chose adjacent healthy cartilage as a comparison to repair tissue. In healthy control cartilage, T2 values between groups were comparable at each follow-up time point. T2 spatial variation of normal cartilage showed an increased trend from the deep to superficial zones, as previous studies have reported[25],[31]. This correlated with type II collagen fiber matrix organization in each zone of hyaline cartilage.
Considering full-thickness T2 values in the two groups in follow-up period, repair tissue was characterized by high mean T2 values versus adjacent healthy cartilage in early follow-up period (6 weeks and 12 weeks postoperatively). These higher T2 values are probably inherent to chondral edema and a difference in matrix content versus adjacent healthy cartilage. T2 values of repair tissue in the single mosaicplasty group were still significantly higher than in the healthy control cartilage at 26 weeks. In addition, dead space regions at graft-host interface were commonly associated with prolonged T2 relaxation time. This phenomenon was also reported in a canine model study after OAT by Glenn et al.[28]. In another study by Salzmann et al.[25], OAT plugs also demonstrated elevated T2 values compared to healthy control cartilage. Furthermore, significantly different T2 values were found in the immediate adjacent regions surrounding the cylinders after OAT. A possible explanation is that OAT plugs do not integrate at the chondral margin. However, T2 values of repair tissue after MACI were significantly lower compared with healthy control cartilage. In our study, we demonstrated that elevated T2 values in the repair tissue after OAT was associated with poor integration among plugs, leading to a higher water concentration and faster water mobility in those regions. However, in the experimental group at longer follow up intervals (18 weeks postoperatively), full-thickness T2 repair tissue values approached those of adjacent normal cartilage as previously reported[9]. These results indicated that repair tissue collagen and water content were similar to the adjacent normal cartilage. The decrease in full-thickness T2 values over time reflects tissue maturation[9]. Thus, full-thickness T2 values demonstrate that mosaicplasty with tissue engineered cartilage can restore full-thickness defects and achieve a good integrative condition.
In our study, besides full-thickness evaluation, the zonal assessment also provided possible insight into the maturation of cartilage repair tissue. In the longitudinal follow-up by using T2 mapping, over 6 to 26 weeks, the trend of increasing T2 values from deep to superficial cartilage layers became apparent. A significant difference was first found at 18 weeks in the experimental group, indicating that remodeling can occur in repair tissue, resulting in the reorganization of implanted cartilage. However, zonal variation in the depth of repair tissue in controls was not detected at each follow-up time point. At 26 weeks, histologic outcomes demonstrated that defects in the experimental group were covered by hyaline-like cartilage, including the dead spaces filled by tissue engineered cartilage. In the control group, only a small amount of fibrous tissue was observed in dead space. Although cartilage autografts survived as hyaline cartilage, the poor integration of the dead space between grafts may lead to inferior properties of the whole repair tissue versus native cartilage in the control group. The fissure existence and fibrous materials filling in the defect may provide abnormal stress distribution with weight-bearing which produce change in autografts cartilage matrix. The different T2 spatial distribution between groups may be based on differences in composition of the repair tissue, maturation and integration of cartilage repair tissue.
Previous histologically validated animal studies also revealed the increase in zonal T2 as an indicator of the formation of hyaline or hyaline-like cartilage structure of the cartilage repair tissue[10],[18]. The zonal variation of T2 values was observed in human cartilage repair tissue after MACI[7],[9]. Thus, full-thickness assessment may aid in the visualization of the maturation of cartilage repair tissue. In our study, T2 maps were used to characterize cartilage repair tissue as a virtual biopsy and provided initial information about the integration of repair tissue.
This study had several limitations. Firstly, the sample size was small with a relatively short-term follow-up period. Additional studies with larger numbers of samples, long-term follow-up and more new repair procedures are necessary to validate the approach of T2 mapping as a measure of the quality of repair tissue. Secondly, there were no histologic and pathologic results compared to MR results before 26 weeks, due to the small number of specimens and good repair efficacy in the long-term follow-up. On the other hand, at 26 weeks, we did find clear histologic correlation with MR findings. In addition, partial volume effects have limited the results concerning zonal variation due to thinner cartilage diameter. Multiple ROI measurements may diminish this error. Finally, the imaging of the cartilage repair tissue is more challenging than the imaging of native articular cartilage in many ways, due to the different repair procedures applied. Standardized assessment protocols for cartilage repair would be ideal.
In conclusion, we have demonstrated the superiority of mosaicplasty with tissue engineered cartilage over single mosaicplasty for the repair of articular defects in the knee. Tissue engineered cartilage can promote the integration of dead spaces in single mosaicplasty. MRI is a noninvasive method for monitoring the development and integration of cartilage repair tissue. Full-thickness and zonal T2 analysis may provide additional information concerning the maturation of cartilage repair tissue in vivo.
References
- 1.Curl WW, Krome J, Gordon ES, Rushing J, Smith BP, Poehling GG. Cartilage injuries: a review of 31,516 knee arthroscopies. Arthroscopy. 1997;13:456–60. doi: 10.1016/s0749-8063(97)90124-9. [DOI] [PubMed] [Google Scholar]
- 2.Messner K, Maletius W. The long-term prognosis for severe damage to weight-bearing cartilage in the knee: a 14-year clinical and radiographic follow-up in 28 young athletes. Acta Orthop Scand. 1996;67:165–8. doi: 10.3109/17453679608994664. [DOI] [PubMed] [Google Scholar]
- 3.Hunziker EB. Articular cartilage repair: basic science and clinical progress. A review of the current status and prospects. Osteoarthritis Cartilage. 2002;10:432–63. doi: 10.1053/joca.2002.0801. [DOI] [PubMed] [Google Scholar]
- 4.Mandelbaum BR, Browne JE, Fu F, Micheli L, Mosely JB, Jr, Erggelet C, et al. Articular cartilage lesions of the knee. Am J Sports Med. 1998;26:853–61. doi: 10.1177/03635465980260062201. [DOI] [PubMed] [Google Scholar]
- 5.Hangody L, Füles P. Autologous osteochondral mosaicplasty for the treatment of full-thickness defects of weight-bearing joints: ten years of experimental and clinical experience. J Bone Joint Surg Am. 2003;85:25–32. doi: 10.2106/00004623-200300002-00004. [DOI] [PubMed] [Google Scholar]
- 6.Horas U, Pelinkovic D, Herr G, Aigner T, Schnettler R. Autologous chondrocyte implantation and osteochondral cylinder transplantation in cartilage repair of the knee joint. A prospective, comparative trial. J Bone Joint Surg Am. 2003;85:185–92. doi: 10.2106/00004623-200302000-00001. [DOI] [PubMed] [Google Scholar]
- 7.Welsch GH, Mamisch TC, Domayer SE, Dorotka R, Kutscha-Lissberg F, Marlvits S, et al. Cartilage T2 assessment at 3-T MR imaging: in vivo differentiation of normal hyaline cartilage from reparative tissue after two cartilage repair procedures–initial experience. Radiology. 2008;247:154–61. doi: 10.1148/radiol.2471070688. [DOI] [PubMed] [Google Scholar]
- 8.Welsch GH, Mamisch TC, Marlovits S, Glaser C, Friedrich K, Hennig FF, et al. Quantitative T2 Mapping during follow-up after matrix-associated autologous chondrocyte transplantation (MACT): full-thickness and zonal evaluation to visualize the maturation of cartilage repair tissue. J Orthop Res. 2009;27:957–63. doi: 10.1002/jor.20835. [DOI] [PubMed] [Google Scholar]
- 9.Trattnig S, Mamisch TC, Welsch GH, Glaser C, Szomolanyi P, Gebetsroither S, et al. Quantitative T2 mapping of matrix-associated autologous chondrocyte transplantation at 3 Tesla: an in vivo cross-sectional study. Invest Radiol. 2007;42:442–8. doi: 10.1097/01.rli.0000262088.67368.49. [DOI] [PubMed] [Google Scholar]
- 10.White LM, Sussman MS, Hurtig M, Probyn L, Tomlinson G, Kandel R. Cartilage T2 assessment: differentiation of normal hyaline cartilage and reparative tissue after arthroscopic cartilage repair in equine subjects. Radiology. 2006;241:407–14. doi: 10.1148/radiol.2412051750. [DOI] [PubMed] [Google Scholar]
- 11.Hangody L, Vásárhelyi G, Hangody LR, Sükösd Z, Tibay G, Bartha L, et al. Autologous osteochondral grafting–technique and long-term results. Injury. 2008;39:32–9. doi: 10.1016/j.injury.2008.01.041. [DOI] [PubMed] [Google Scholar]
- 12.Robert H. Chondral repair of the knee joint using mosaicplasty. Ortho Traumatol Surg Res. 2011;97:418–29. doi: 10.1016/j.otsr.2011.04.001. [DOI] [PubMed] [Google Scholar]
- 13.Szerb I, Hangody L, Duska Z, Kaposi NP. Mosaicplasty: long-term follow-up. Bull Hosp Jt Dis. 2005;63:54–62. [PubMed] [Google Scholar]
- 14.Lane JG, Massie JB, Ball ST, Amiel ME, Chen AC, Bae WC, et al. Follow-up of osteochondral plug transfers in a goat model: a 6-month study. Am J Sports Med. 2004;32:1440–50. doi: 10.1177/0363546504263945. [DOI] [PubMed] [Google Scholar]
- 15.Miyata S, Numano T, Homma K, Tateishi T, Ushida T. Feasibility of noninvasive evaluation of biophysical properties of tissue—engineered cartilage by using quantitative MRI. J Biomech. 2007;40:2990–8. doi: 10.1016/j.jbiomech.2007.02.002. [DOI] [PubMed] [Google Scholar]
- 16.Burstein D, Gray ML. Is MRI fulfilling its promise for molecular imaging of cartilage in arthritis? Osteoarthritis Cartilage. 2006;14:1087–90. doi: 10.1016/j.joca.2006.07.001. [DOI] [PubMed] [Google Scholar]
- 17.Watrin-Pinzano A, Ruaud JP, Cheli Y, Gonord P, Grossin L, Bettembourg-Brault l, et al. Evaluation of cartilage repair tissue after biomaterial implantation in rat patella by using T2 mapping. MAGMA. 2004;17:219–28. doi: 10.1007/s10334-004-0071-7. [DOI] [PubMed] [Google Scholar]
- 18.Marlovits S, Striessnig G, Resinger CT, Aldrian SM, Vecsei V, lmhof H, et al. Definition of pertinent parameters for the evaluation of articular cartilage repair tissue with high-resolution magnetic resonance imaging. Eur J Radiol. 2004;52:310–9. doi: 10.1016/j.ejrad.2004.03.014. [DOI] [PubMed] [Google Scholar]
- 19.Wayne JS, McDowell CL, Shields KJ, Tuan RS. In vivo response of polylactic acid-alginate scaffolds and bone marrow-derived cells for cartilage tissue engineering. Tissue Eng. 2005;11:953–63. doi: 10.1089/ten.2005.11.953. [DOI] [PubMed] [Google Scholar]
- 20.Shimomura K, Ando W, Tateishi K, Nansai R, Fujie H, Hart DA, et al. The influence of skeletal maturity on allogenic synovial mesenchymal stem cell-based repair of cartilage in a large animal model. Biomaterials. 2010;31:8004–11. doi: 10.1016/j.biomaterials.2010.07.017. [DOI] [PubMed] [Google Scholar]
- 21.Tognana E, Chen F, Padera RF, Leddy HA, Christensen SE, Guilak F, et al. Adjacent tissues (cartilage, bone) affect the functional integration of engineered calf cartilage in vitro. Osteoarthritis Cartilage. 2005;13:129–38. doi: 10.1016/j.joca.2004.10.015. [DOI] [PubMed] [Google Scholar]
- 22.Theodoropoulos JS, De Croos JN, Park SS, Pilliar R, Kandel RA. Integration of tissue-engineered cartilage with host cartilage: an in vitro model. Clin Orthop Relat Res. 2011;469:2785–95. doi: 10.1007/s11999-011-1856-4. [DOI] [PMC free article] [PubMed] [Google Scholar]
- 23.Sun J, Hou XK, Li X, Tang TT, Zhang RM, Kuang Y, et al. Mosaicplasty associated with gene enhanced tissue engineering for the treatment of acute osteochondral defects in a goat model. Arch Orthop Trauma Surg. 2009;129:757–71. doi: 10.1007/s00402-008-0761-0. [DOI] [PubMed] [Google Scholar]
- 24.Salzmann GM, Paul J, Bauer JS, Woertler K, Sauerschnig M, Landwehr S, et al. T2 assessment and clinical outcome following autologous matrix-assisted chondrocyte and osteochondral autograft transplantation. Osteoarthritis Cartilage. 2009;17:1576–82. doi: 10.1016/j.joca.2009.07.010. [DOI] [PubMed] [Google Scholar]
- 25.Link TM, Mischung J, Wörtler K, Burkart A, Rummeny EJ, Imhoff AB. Normal and pathological MR findings in osteochondral autografts with longitudinal follow-up. Eur Radiol. 2006;16:88–96. doi: 10.1007/s00330-005-2818-6. [DOI] [PubMed] [Google Scholar]
- 26.Herber S, Runkel M, Pitton MB, Kalden P, Thelen M, Kreitner KF. Indirect MR-arthrography in the follow up of autologous osteochondral transplantation. Rofo. 2003;175:226–33. doi: 10.1055/s-2003-37236. [DOI] [PubMed] [Google Scholar]
- 27.Glenn RE, McCarty EC, Potter HG, Juliao SF, Gordon JD, Spindler KP. Comparison of fresh osteochondral autografts and allografts: a canine model. Am J Sports Med. 2006;34:1084–93. doi: 10.1177/0363546505284846. [DOI] [PubMed] [Google Scholar]
- 28.Marlovits S, Singer P, Zeller P, Mandl I, Haller J, Trattnig S. Magnetic resonance observation of cartilage repair tissue (MOCART) for the evaluation of autologous chondrocyte transplantation: determination of interobserver variability and correlation to clinical outcome after 2 years. Eur J Radiol. 2006;57:16–23. doi: 10.1016/j.ejrad.2005.08.007. [DOI] [PubMed] [Google Scholar]
- 29.Trattnig S, Ba-Ssalamah A, Pinker K, Plank C, Vecsei V, Marlovits S. Matrix-based autologous chondrocyte implantation for cartilage repair: noninvasive monitoring by high-resolution magnetic resonance imaging. Magn Reson Imaging. 2005;23:779–87. doi: 10.1016/j.mri.2005.04.010. [DOI] [PubMed] [Google Scholar]
- 30.Tins BJ, McCall IW, Takahashi T, Cassar-Pullicino V, Roberts S, Ashton B, et al. Autologous chondrocyte implantation in knee joint: MR imaging and histologic features at 1-year follow-up. Radiology. 2005;234:501–8. doi: 10.1148/radiol.2342031970. [DOI] [PubMed] [Google Scholar]
- 31.Smith HE, Mosher TJ, Dardzinski BJ, Collins BG, Collins CM, Yang QX, et al. Spatial variation in cartilage T2 of the knee. J Magn Reson Imaging. 2001;14:50–5. doi: 10.1002/jmri.1150. [DOI] [PubMed] [Google Scholar]