
Figure 1.
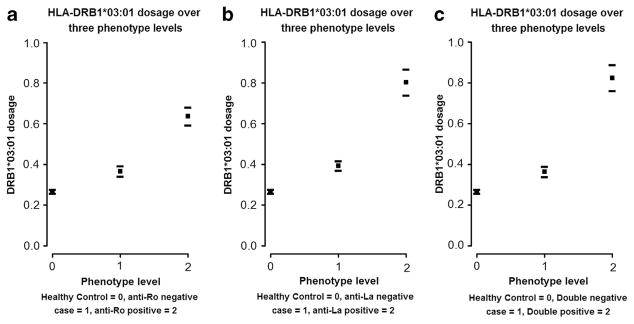
HLA-DRB1*03:01 dosage (average number of alleles observed) over levels of disease (a): (healthy controls/anti-Ro( −)/anti-Ro( +)); (b): (healthy controls/anti-La( −)/anti-La( +)); (c) (healthy controls/anti-Ro( −) AND anti-La( −)/anti-Ro( +) AND anti-La( +)/). Average dosage is represented by a square, whereas upper and lower 95% confidence intervals are represented by ‘ −’. Note that dosage ranges from 0 to 2 for each subject and so to convert to allele frequency you must divide by 2. All three plots have been truncated at 1.