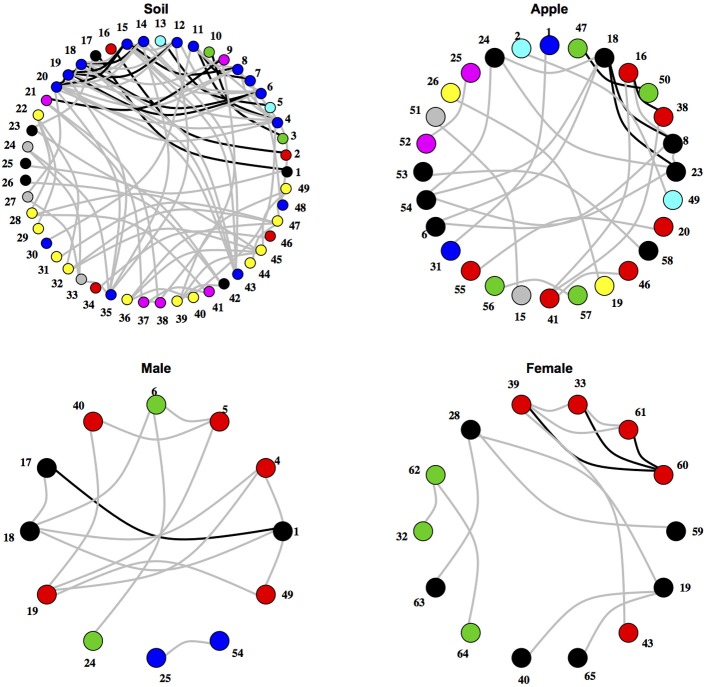
Figure 2.
Networks of co-occurring microbial orders within ecosystems. Networks represent relationships between co-occurring ecosystems. Edges colored in black represent co-occurrence relationships that were consistent at the 0.75 correlation level, while edges in gray represent co-occurrence relationships that were consistent at the 0.5 correlation level. Numbers represent microbial orders seen in Supplementary Table 6. Node color represents module membership.

