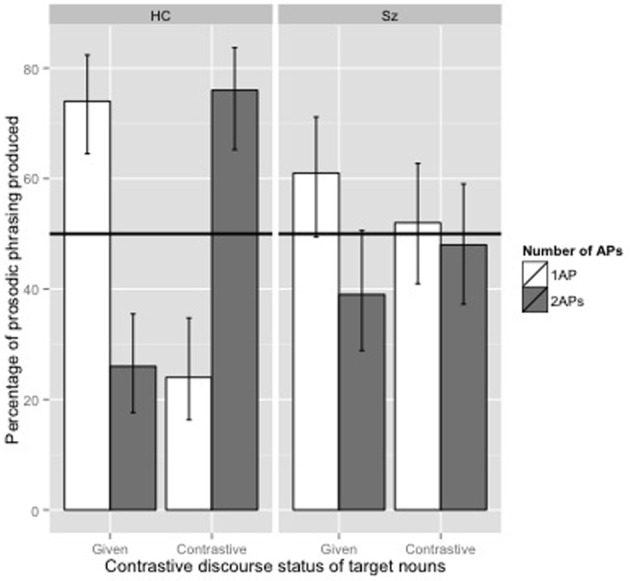
Figure 3.

Percentage of prosodic phrasing produced by healthy controls participants (HC) and participants with schizophrenia (SZ) depending on the number of APs they produced (1 AP vs. 2 APs) and the contrastive discourse status of target nouns (given vs. contrastive). Error bars show a default 95% confidence interval.
