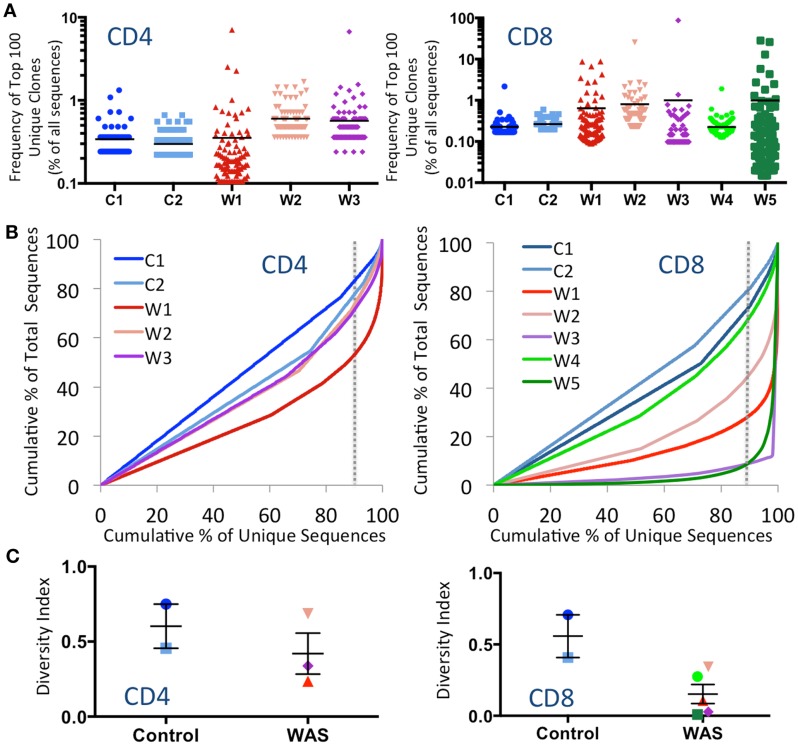
Figure 1.
Clonal expansions and diversity of the CD4+ and CD8+ TRB repertoire. (A) The relative frequency of the 100 most abundant clones is displayed as a proportion of the total sequences for both CD4+ (left panel) and CD8+ (right panel) populations. The black line indicates the mean of the sample. (B) The degree of clonal expansion for CD4+ and CD8+ populations is displayed by plotting the cumulative percentage of unique clones (x) vs. the cumulative percentage of total sequences (y). A slope of one would indicate an even distribution of clonotypes. The dotted gray vertical line indicates 90% of cumulative unique sequences, with sequences to the right of the line corresponding to the top 10% most abundant unique clonotypes. (C) The diversity of each patient’s repertoire was determined by dividing the number of unique sequences over the total sequences for CD4+ and CD8+ populations. Bars represent mean and SE. In all panels, the same color is used to identify individual control subjects and patients.

