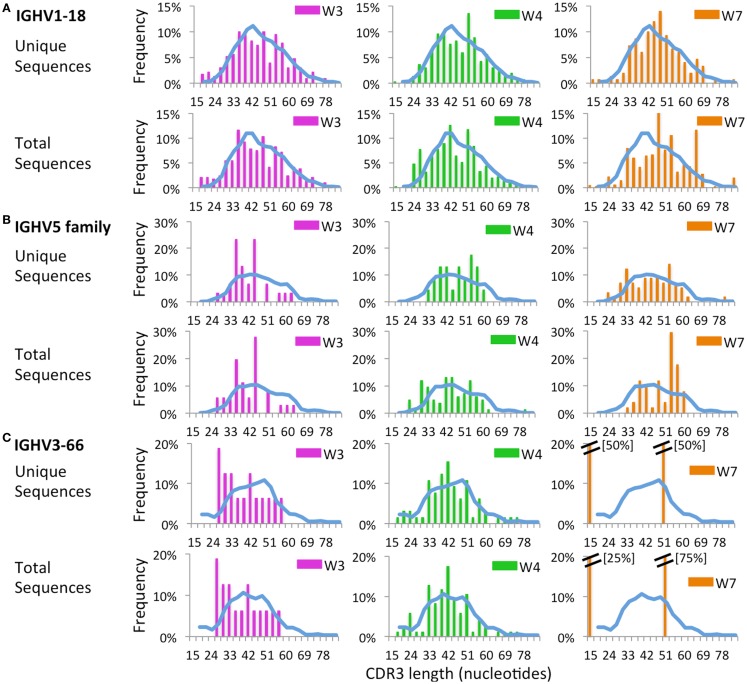
Figure 12.
Complementarity determining region 3 length analysis of IGHV subgroups. CDR3 length analysis was performed on CD19+ cells expressing IGHV1-18 (A), IGHV5 (B), or IGHV3-66 (C). The mean distribution of controls (C1 and C2) is displayed as a blue bar. A double bar indicates the value of the bar has exceeded the axis limit, and the maximum value is indicated within brackets.

