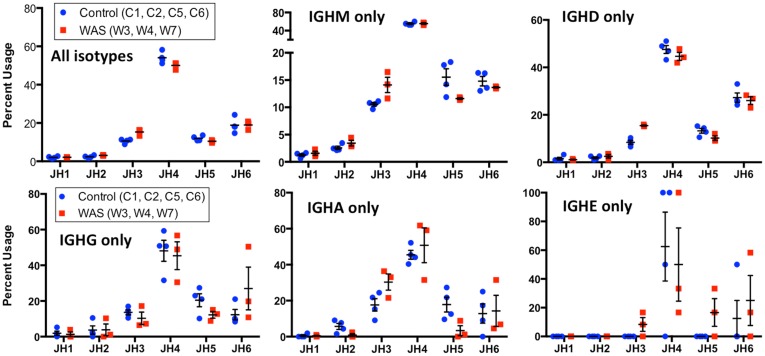
Figure 13.
Usage of IGHC genes in unique IGH sequences from WAS patients and controls. Usage of IGHC families is displayed as the percentage of the total number of unique clonotypes for both control (blue dots) and WAS patients (red squares). Results are shown for all isotypes and for individual isotypes. Bars indicate the mean and SE.

