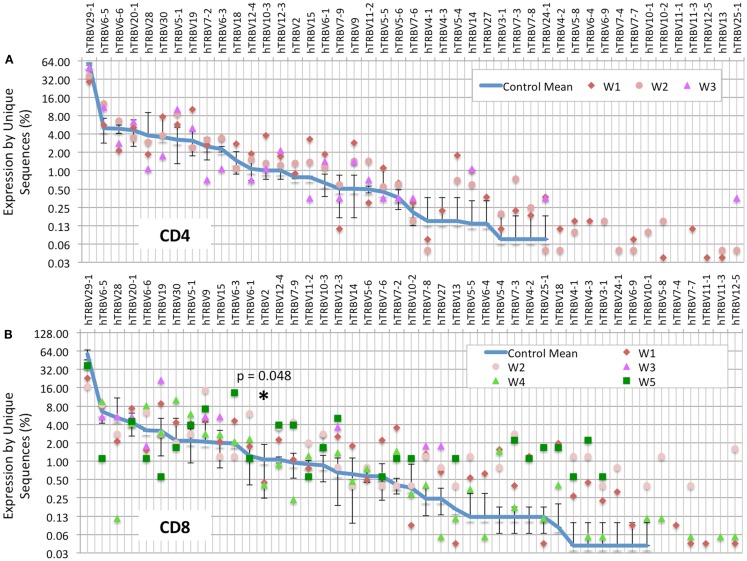
Figure 2.
TRBV gene usage is skewed in the CD8+ population of WAS patients. The frequency of usage of individual TRBV genes among unique TRB sequences is displayed for the CD4+ (A) or CD8+ (B) cells. The blue line indicates the average frequency of the two control subjects, and the error bars indicate the SD of the frequency of the controls. p Values were calculated using Mann–Whitney test between controls and WAS for each V segment. *p < 0.05.

