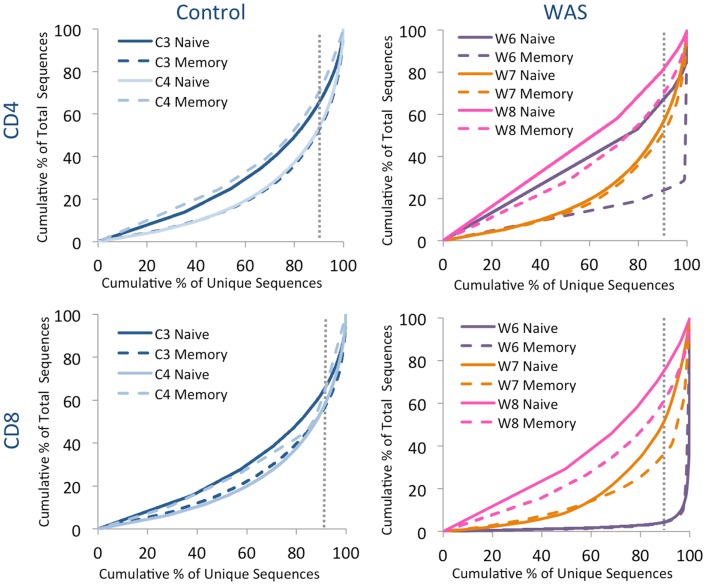
Figure 6.
Clonal expansion of the TRB repertoire in CD4+ and CD8+ naïve and memory lymphocytes. The degree of clonal expansion for each patient’s repertoire is displayed by plotting the cumulative percentage of unique sequences (x) vs. the cumulative percentage of total sequences (y) in controls (left panels) and patients (right panels). A slope of one would indicate an even distribution of clonotypes. The dotted gray vertical line indicates 90% of cumulative unique sequences, with sequences to the right of the line corresponding to the top 10% most abundant clonotypes.

