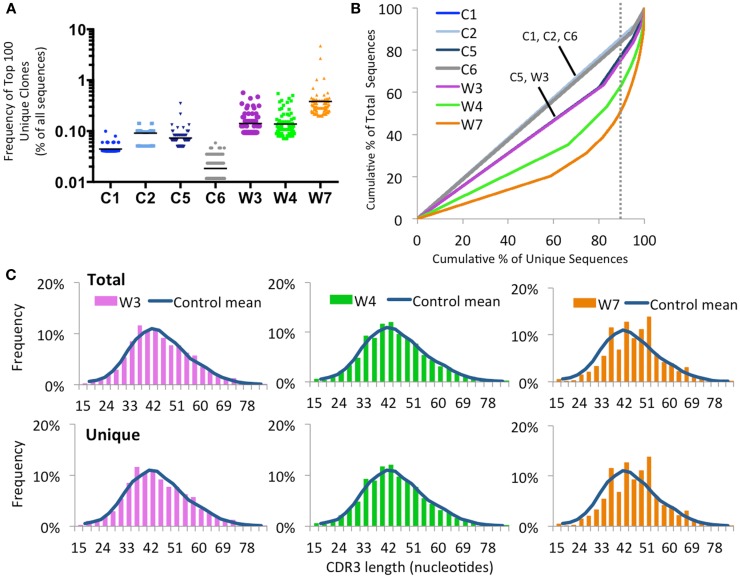
Figure 9.
Clonal expansion of the IGH repertoire in circulating CD19+ lymphocytes. (A) The relative frequency of the 100 most abundant clones is displayed as a proportion of the total sequences in four healthy controls (C1–C4) and three WAS patients (W3, W4, and W7). The black line indicates the mean of the sample. (B) The degree of clonal expansion for each patient’s repertoire is displayed by plotting the cumulative percentage of unique clones (x) vs. the cumulative percentage of total sequences (y). A slope of one would indicate an even distribution of clonotypes. The dotted gray vertical line indicates 90% of cumulative unique sequences, with sequences to the right of the line corresponding to the top 10% most abundant clonotypes. (C) Distribution of CDR3 nucleotide length frequencies for both total and unique sequences in individual WAS patients compared to the mean in controls C1 and C2 (shown as a curve).

