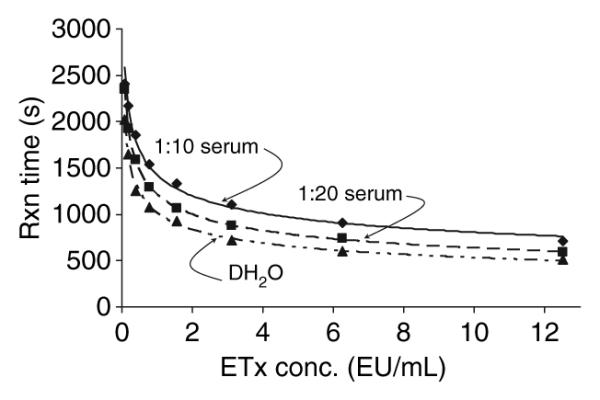
Fig. 1.

Dose–response curves for endotoxin activity reactions with Escherichia coli lipopolysaccharide. The standard method is the curve of lipopolysaccharide diluted in DH2O. Comparisons were made with identical concentrations of lipopolysaccharide diluted 1:10 and 1:20 in normal human serum containing no detectable endotoxin activity. The curves were derived from triplicate determinations for each condition. Etx, endotoxin activity; Rxn, reaction.
