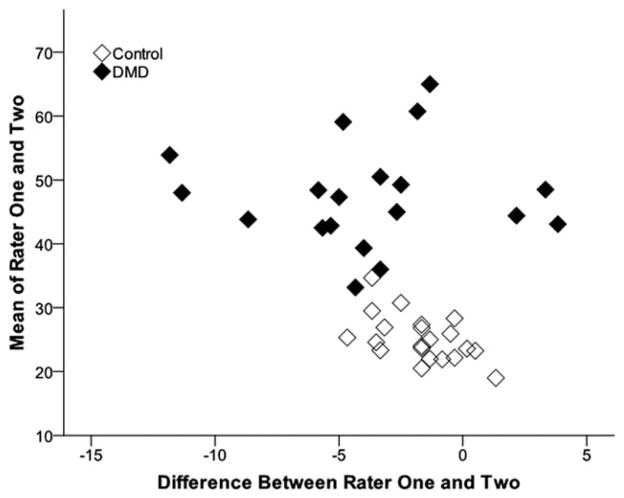
FIGURE 2.
Bland–Altman plots of gray scale levels of muscle measured by 2 analysts. The average muscle GSLs quantified by experienced (rater 1) and inexperienced (rater 2) evaluators are also similar across a wide range of GSLs and show only a small bias (mean difference −2.7 GSL) between image analysts.

