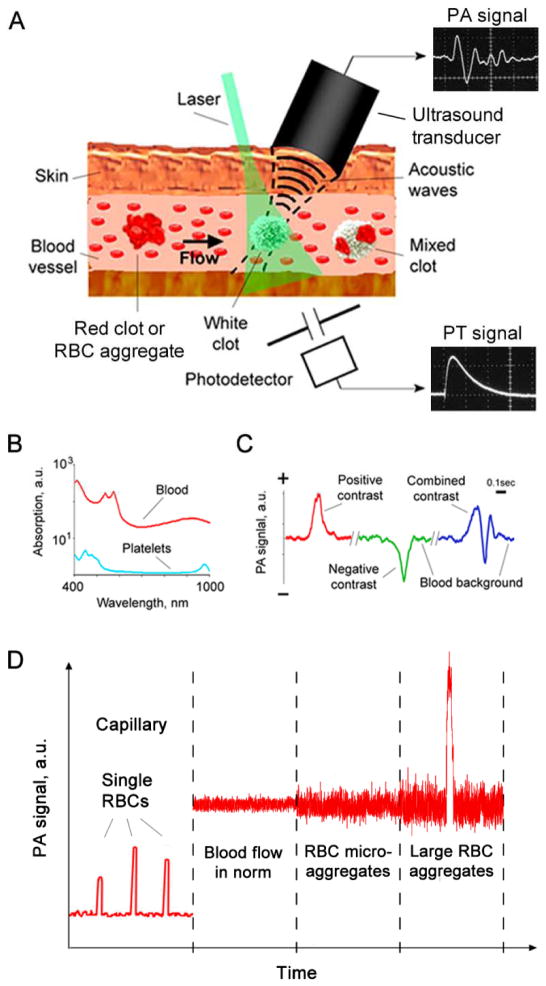
Fig. 12.
PA flow cytometry. (a) Schematic. (b) Absorption spectra of whole blood (red) and platelet-rich plasma (blue). (c) Example of PA positive, negative, and combined contrasts from circulating clots of different compositions. (d) PA signal trace dynamics obtained with PA fluctuation flow cytometry in different vessels in normal and pathological conditions leading to RBC aggregation. Reprint with permission from Ref. (97).

