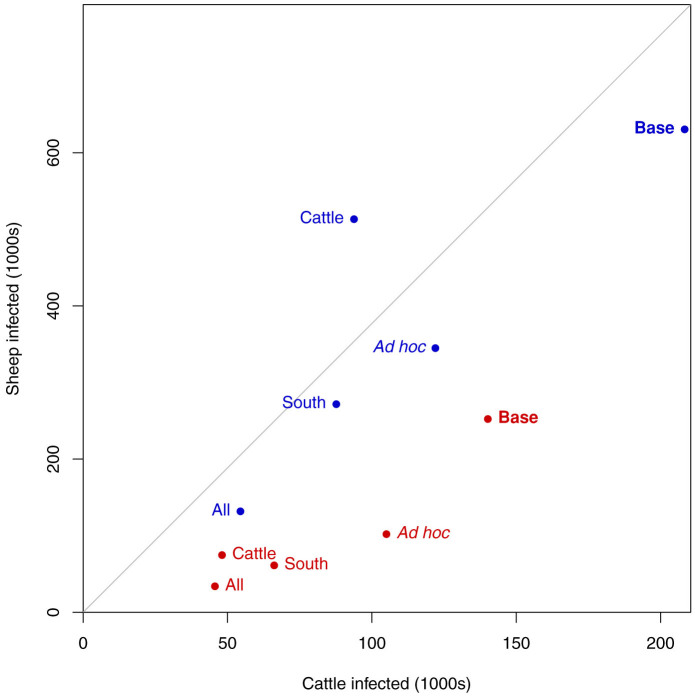
Figure 6. The numbers of infected animals resulting from disease introduction under different vaccination strategies.
The red points are vaccination with a vector feeding preference for cattle and blue points the vaccination strategy without feeding preference. “Base” refers to no vaccination. The grey centre line is the equality line – if sheep and cattle were becoming infected at equal rates relative to their population.

