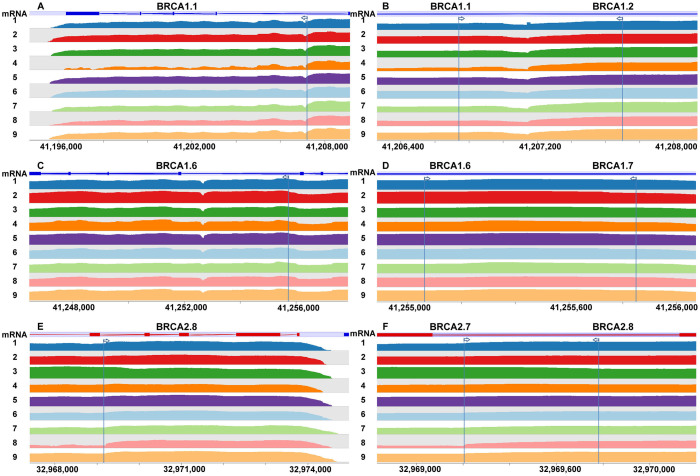
Figure 4. Visualization of sequencing read depth in SeqMonk for three amplicons previously used for comparing enzymes.
Left column shows amplicons BRCA1.1, BRCA1.6 and BRCA2.8 and their boundaries. Right column shows junction regions. Arrows indicate boundaries. Coverage is log2-transformed. The coverage plot demonstrates that significant variations of read depth may still exist within and between amplicons from long-range PCR. Loss of coverage may occur at junction of two amplicons (B), but can be recovered by larger overlapping of two amplicons (D, F).

