
Fig. 7. Effect of phenylbutyrate on zebrafish noam631 mutants.
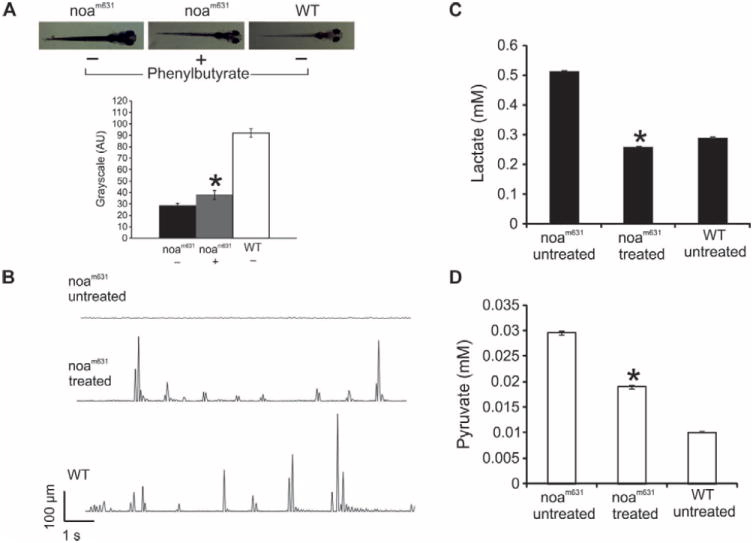
A. Pigmentation phenotype of untreated noam631, treated mutant noam631 and untreated wild-type larvae at 8 days after fertilization (n=14 per group). The bar graph shows quantification of zebrafish pigmentation, calculated with ImageJ software reporting mean gray value for a given area. The binary representation assumes that 0 is black and the maximum value (255 at 8 bit) is white. B. Movements of the larvae are plotted as the distance travelled by the larvae relative to time in 48-well plate, as previously described (31). C and D. Lactate and pyruvate concentrations in untreated or treated mutant noam631 larvae and in wild-type larvae (n=6 per group). *: p<0.05.