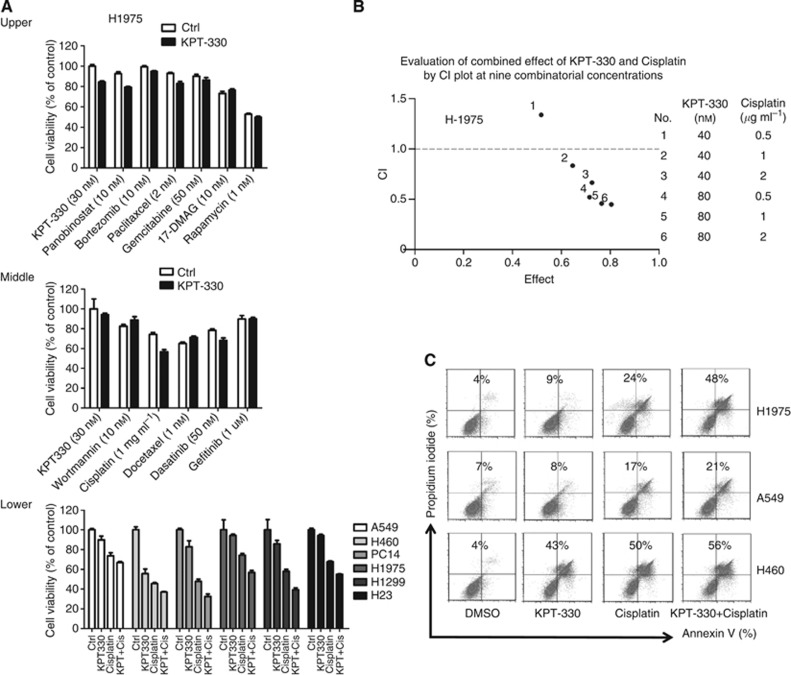
Figure 4.
Drug combinations with NSCLC cells. (A) Upper and middle panel: H1975 cells were cultured with either KPT-330 (30 nM), diluent (control), experimental drug, or experimental drug+KPT-330 (+KPT) for 72 h, and cell viability was determined by MTT. Lower panel: combination of KPT-330 with cisplatin cultured with each of six NSCLC cell lines. In each group of four: 1st rectangle is control, 2nd, KPT-330, 3rd, cisplatin, and 4th, combination of KPT-330 and cisplatin. Concentrations of KPT-330 and cisplatin were based on the IC50 of each drug for each NSCLC cell lines. (B) Combinatorial effect of KPT-330 and cisplatin on H1975 displayed as the CI. CI defines the interaction between KPT-330 and cisplatin as plotted against the fraction of cell viability. CI values: 1, additive; <1, synergistic; >1, antagonistic. Table to the right defines each tested concentration of KPT-330 and cisplatin. (C) Cells analysed by flow cytometry for apoptosis (annexin V/propidium iodide positivity) after exposure to either KPT-330 (500 nM); cisplatin (1 μg ml−1); KPT-330+cisplatin, or DMSO diluent (control) for 24 h. Numbers in the figure represent percentage of apoptotic cells (annenxin V alone+PI alone+double positive).

