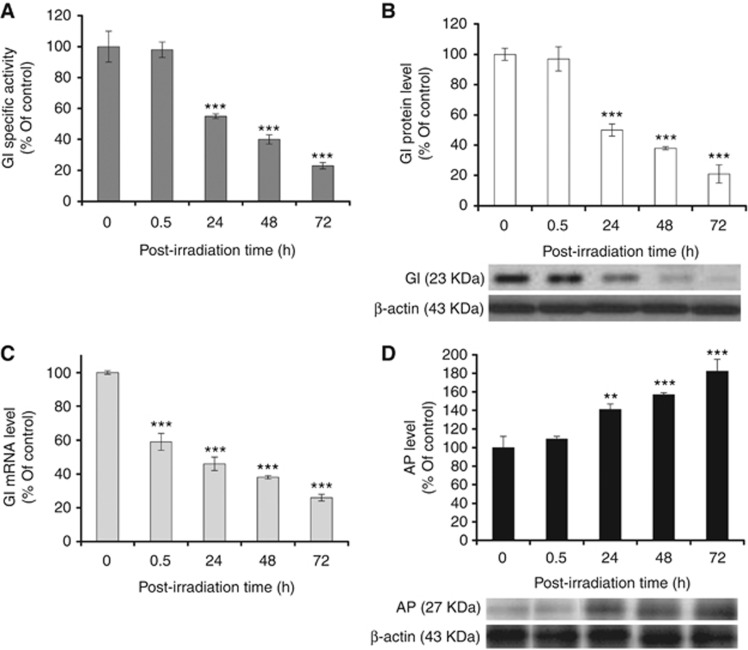
Figure 2.
Glyoxalase I (GI) expression status and argpyrimidine (AP) levels in MCF-7 cells after irradiation. Histograms show (A) GI enzymatic-specific activity, measured by spectrophotometric methods, (B) GI gene expression at protein level, assessed by densitometric analysis from western blot detection, (C) mRNA level by qRT–PCR and (D) AP intracellular levels assessed by densitometric analysis from western blot detection. Western blots were obtained by using the appropriate mAbs. The blots were stripped of the bound Abs and reprobed with anti-β-actin to confirm equal loading. The western blots shown are representative of three separate experiments. All histograms indicate means±s.d. of three different cultures, and each one was tested in quadruplicate and expressed as percentage of unirradiated cells (control). **P<0.01 and ***P<0.001.

