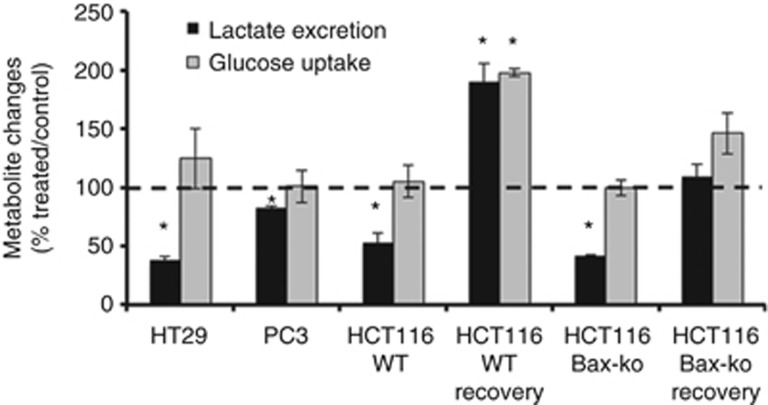
Figure 5.
Excreted lactate levels and glucose uptake measured by 1H-MRS in 24-h DCA-treated HT29, PC3, HCT116 WT and HCT116 Bax-ko cells and at 48 h recovery following 24 h of DCA treatment in HCT116 WT and HCT116 Bax-ko cells as compared with respective 24-h vehicle-treated control. Data are expressed as mean percentage ratio±s.e.m. (minimum n=3 in each group). Statistically significant changes are indicated (*P<0.0001).

