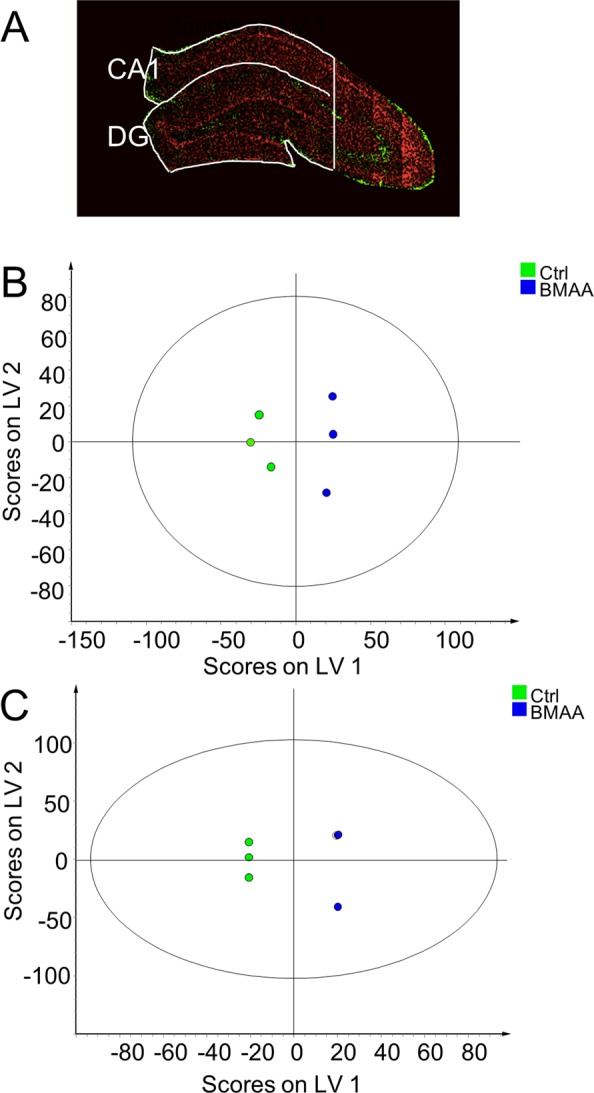
Figure 4.

Multivariate analysis of spectral data reveals BMAA-induced hippocampal changes. MAF analysis was used to segment the hippocampal images into regions representing CA1 and DG (A). OPLS-DA models were calculated for both regions, clearly separating the control group from the BMAA group. (B) The analysis resulted in a 1 + 3 (1 predictive- + 3 orthogonal components) model for DG. The model explained 86% of the variation in the data set (R2X cumulative) with a predictive power of 0.96 (Q2 cumulative). (C) For the CA1, we obtained a 1 + 1 (1 predictive- + 3 orthogonal components) model, where 53% of the variation was explained with a predicative power of 0.61 (Q2 cumulative).
