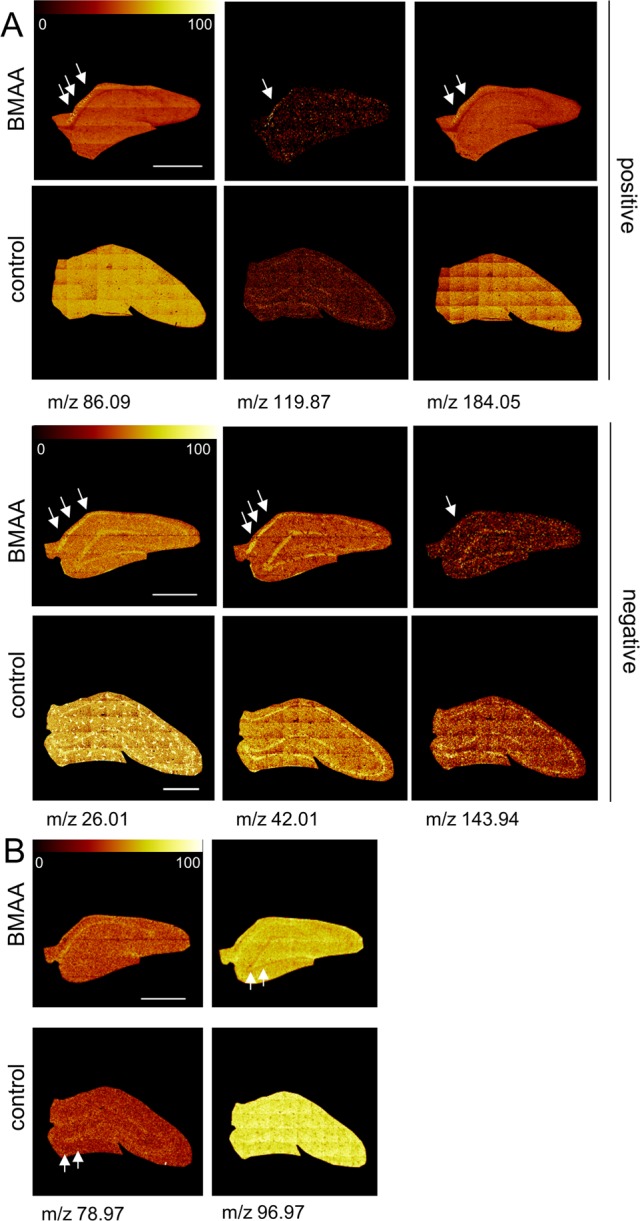
Figure 5.

BMAA-induced changes of distinct molecular species in the hippocampus. Selective changes in the brain sections were identified in an unbiased way using multivariate analysis of spectral data. (A) In positive mode, the loadings reveal a significant increase of several mass peaks in the CA1 of BMMA-exposed animals compared to controls, including phospholipid fragments (TME, M[C5H12N+] 86.09; PC, M[C5H15PNO4+] 184.05), and protein adduct (M[K2CNO+] 119.87). (B) In negative mode, inspection of the imaging data show increase of protein associated signals (M[CN–] 26.01, M[CNO–] 42.00) as well as an unidentified peak, m/z 143.94 that were found to localize to the histopathologically altered CA1 region in the hippocampus (arrows) of BMAA animals compared to controls. (B) DG specific regulations comprised phosphate signals (M[PO3–] 79, M[H2PO4–] 97) that were found to be decreased in BMAA exposed animals compared to controls (scale bar = 1 mm; color scale indicates relative intensity in %).
