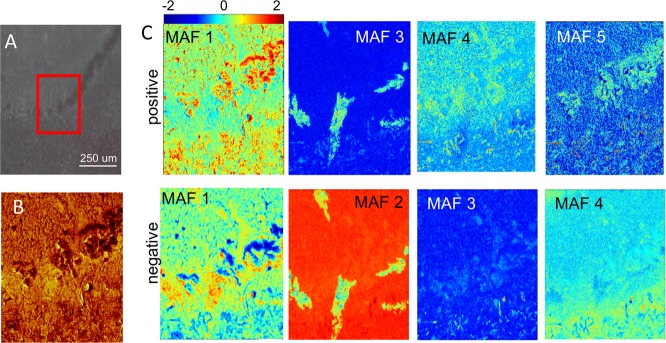
Figure 6.

Burst alignment analysis of the BMAA-induced hippocampal changes. (A) Camera image showing the histopathologically altered region in the hippocampus of BMAA-treated rats. An area of 250 μm × 250 μm was analyzed by ToF-SIMS in burst-aligned mode (red square). (B) Total ion image of pos. ion mode image data for the analyzed region of interest (ROI). (C) MAF analysis of ROI data acquired in positive and negative ion mode showed chemical differences that allow for discrimination of the lesioned region based on the chemical composition as revealed by the corresponding loadings. The false color intensity represents the score (eigenvalue) for each pixel for different factors (i.e., MAF 1–5).
