Figure 7.
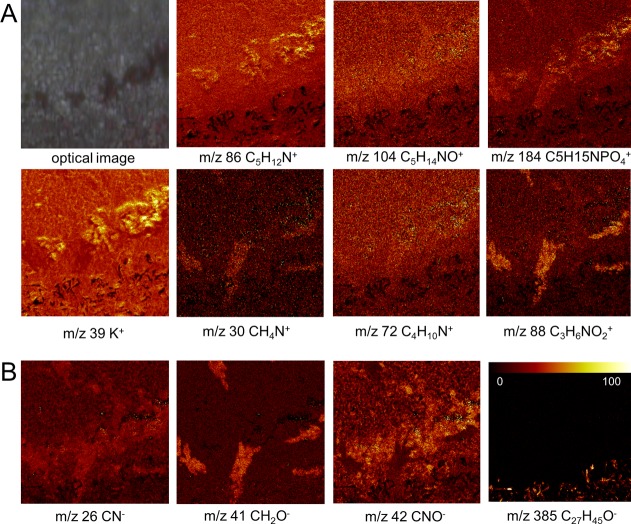
Single ion images of the BMAA-induced hippocampal changes. Manual inspection of variables (m/z) that showed the highest loading values in MAF based image analysis. (Camera image shows histopathological lesions observed in the CA1 region.) (A) In positive mode, the MAF data show phosphatidylcholine headgroup (PC, m/z 184) and its fragments (m/z 86 (TME, C5H12N+), m/z 104 (choline, C5H14NO+)) to be increased and localized to the CA1 in BMAA-treated rats, suggesting elevated phospholipid levels as a consequence of gliosis. Similarly, specific amino acid fragments (m/z 30, glycine; m/z 72, valine; m/z 88, aspartate) were increased at the BMAA-induced lesions in CA1 indicating protein increase, as a result of gliosis or protein aggregation. In addition, increased potassium (K+) levels were observed that localize to the lesions. (B) Similar findings were observed for protein fragments (CN–, C2HO–, CNO–) in negative mode. Furthermore, elevated cholesterol levels were observed in the MAF loadings, which is a consequence of the adjacent white matter region (m/z 385). (Image size 250 × 250 μm; color scale indicates relative intensity in %.)

