Abstract

Radiosynthesis of a fluorine-18 labeled organophosphate (OP) inhibitor of acetylcholinesterase (AChE) and subsequent positron emission tomography (PET) imaging using the tracer in the rat central nervous system are reported. The tracer structure, which contains a novel β-fluoroethoxy phosphoester moiety, was designed as an insecticide-chemical nerve agent hybrid to optimize handling and the desired target reactivity. Radiosynthesis of the β-fluoroethoxy tracer is described that utilizes a [18F]prosthetic group coupling approach. The imaging utility of the [18F]tracer is demonstrated in vivo within rats by the evaluation of its brain penetration and cerebral distribution qualities in the absence and presence of a challenge agent. The tracer effectively penetrates brain and localizes to cerebral regions known to correlate with the expression of the AChE target. Brain pharmacokinetic properties of the tracer are consistent with the formation of an OP-adducted acetylcholinesterase containing the fluoroethoxy tracer group. Based on the initial favorable in vivo qualities found in rat, additional [18F]tracer studies are ongoing to exploit the technology to dynamically probe organophosphate mechanisms of action in mammalian live tissues.
Keywords: Acetylcholinesterase, organophosphate, fluorine-18, radiotracer, PET imaging, brain
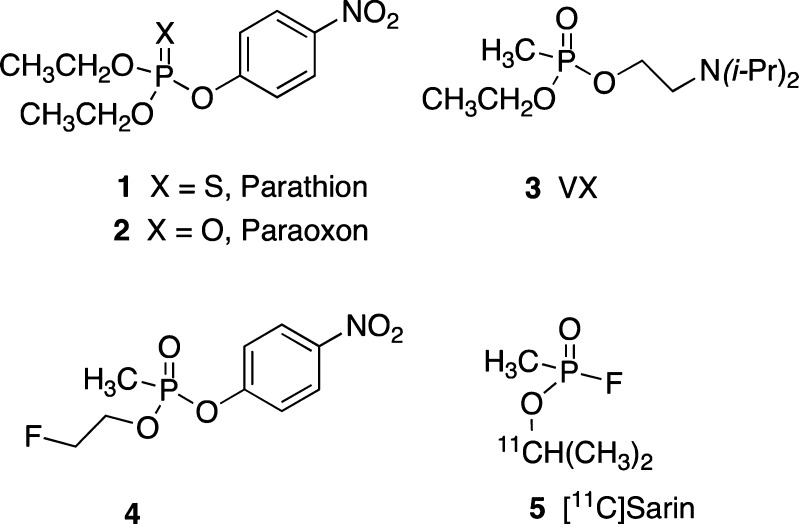
Organophosphorus (OP) compounds are a diverse class of chemicals that include insecticides (e.g., parathion; 1) and chemical nerve agents (e.g., VX; Figure 1, 3).1,2 Parathion itself is relatively unreactive owing to the stable P=S bond and requires oxidation to the reactive oxon form (P=O; 2) to elicit the mode of action.1,3 Conversely, VX (3) exists in the oxon form and is a highly reactive, nondiscriminating phosphorylating agent.2,4 Thus, the P=O bond is a key determinant of OP reactivity. Most OP insecticides are triesters in which two of the groups are methyl or ethyl esters and one is a leaving group (e.g., para-nitrophenoxy) that is ejected upon reaction with target proteins. Nerve agents also contain a leaving group although it differs as a fluorine atom (gas agent) or an N,N-disubstituted β-aminothiol group (dermal agent). Nerve agents also differ from insecticides due to the presence of a methyl-phosphorus linkage (methyl phosphonate) that cannot be cleaved in biological processes.
Figure 1.
Select organophosphate (OP) agents.
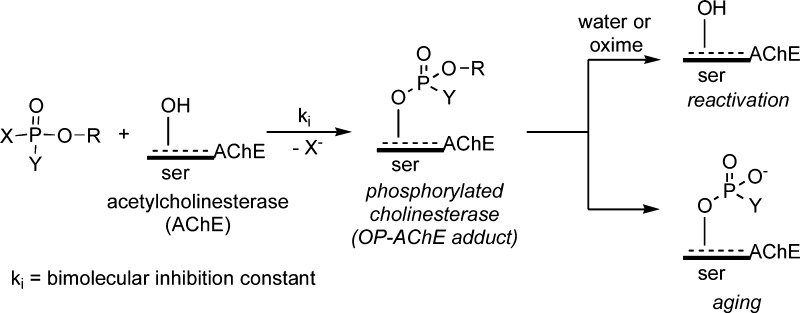
The toxicity of OP insecticide oxons and nerve agents to humans is generally attributed to the inhibition (inactivation) of acetylcholinesterase (AChE) in central and peripheral nervous tissues.2 AChE is responsible for the hydrolysis of the neurotransmitter acetylcholine (ACh) where inactivation results in an increase of synaptic ACh that triggers neurotoxic events.2,4 Reactive OPs inhibit AChE by attachment to the active site serine (ser) residue by a concomitant loss of a leaving group (e.g., the para-nitrophenoxy (PNP) moiety of 2) to form OP-AChE adducts (Scheme 1).2 The fate of the OP-AChE adduct can involve enzymatic reactivation (activity restoration) or aging, where the latter is defined as loss of a phosphoester group leading to an oxyanion that is intractable to reactivation.2,4,5 Because of the shared AChE inactivation mechanism with nerve agents, OP insecticide use remains controversial, and there is continued interest in better understanding insecticide long-term exposure effects.6
Scheme 1. OP-Inhibition of AChE by Serine (ser) Phosphorylation and Subsequent Reactivation or Aging Processes, Where X Is a Leaving Group and Y Is Either an Alkyl or Alkoxy Moiety.
Medicinal chemistry OP inhibitor structure–activity relationship (SAR) investigations in our laboratories are focused on further defining criteria of central nervous system (CNS) AChE adduct formation and their fates. Of particular interest are OP structures with hybridized features of insecticides and nerve agents that possess CNS penetration properties. For example, we have recently reported7 the characteristics of the novel β-fluoroethoxy-methylphosphonate 4 (Figure 1). This compound has a phosphonomethyl group as in VX, the PNP leaving group found in paraoxon, 2 and the ethyl ester (EtO−) common to both insecticides and nerve agents. And importantly, the putative mechanism of inhibition by compound 4 affords an OP-AChE adduct identical to VX. Since the ethoxy group is not lost during the inhibition, it is a useful group to explore substituents on this moiety. The β-fluoroethoxy analogue 4 is an example of these combined features and was shown to be a potent inhibitor of rat brain AChE (RBAChE) with a measured in vitro concentration-dependent inhibition rate constant7ki = 6.11 ± 0.25 × 10⁶ M–1 min–1. Inhibitor 4 is only 26-fold less potent relative to paraoxon, 2 (ki = 1.58 ± 0.22 × 10⁸ M–1 min–1).7 Based on these in vitro properties, we sought to initially understand the in vivo fate of the cognate 4-AChE adduct and to address a longstanding need to more deeply appreciate OP CNS tissue penetration and distribution profiles in mammals. Since 4 possesses the β-fluoroethoxy group, we considered preparing the fluorine-18 ([18F], 110 min half-life) labeled form of 4 ([18F]4) as a radioligand for [18F]4-AChE adduct studies and a tracer that could be exploited in vivo for CNS positron emission tomography (PET) imaging in mammals.
Altered regional cerebral ACh synaptic concentrations form the basis of the cholinergic deficit hypothesis associated with Alzheimer’s disease (AD).8 A useful approach to assess CNS ACh regional alterations in live brain has been to evaluate AChE tissue concentrations with PET imaging, using custom positron atom-labeled tracers to bind AChE.9−11 For example, carbon-11 ([11C], 20 min half-life) AChE PET imaging agents fashioned as either AChE substrate metabolic trapping tracers or as AChE reversible binding radioligands have been used to advance the understanding of regional AChE tissue concentration changes as a function of imaging subject type.11 Similarly, the OP carbon-11 nerve agent [11C]sarin, 5 (Figure 1), has been reported,12 yet to our knowledge its evaluation in animals has not been detailed, and a fluorine-18 labeled OP inhibitor PET tracer for AChE has yet to be described. To address this particular void in OP PET imaging agents, we describe here the first [18F]labeled OP radioligand, [18F]4, including its original radiosynthesis and preliminary use with microPET imaging in rats as a means to evaluate its CNS tissue penetration and distribution profiles.
Results and Discussion
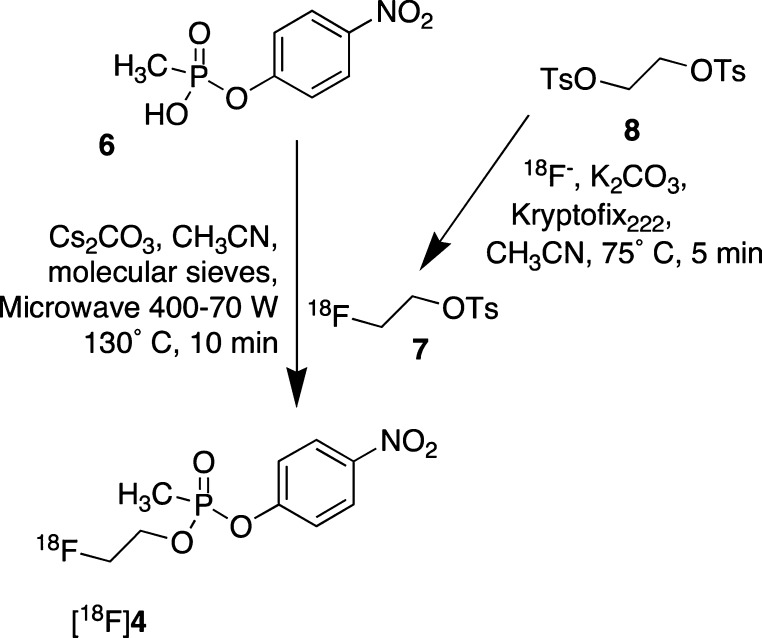
A high specific activity radiosynthesis of [18F]4 was developed according to the route shown in Scheme 2. The approach was based upon literature precedent, including (i) our previously described synthesis of 4 by coupling the methylphosphonic acid PNP-ester 6 with 2-fluoroethanol,7 (ii) the availability of the high specific activity, radiolabeled prosthetic group [18F]2-tosyloxy-1-fluoroethane (7)13,14 readily derived from 1,2-bis-tosyloxyethane (8); and (iii) the formation of radiolabeled carboxylic acid esters employing the radioprosthetic group 7 and select carboxylic acids in the presence of cesium carbonate under microwave-assisted esterification conditions.15
Scheme 2. Radiosynthesis of PET Imaging Tracer [18F]4.
The two step Scheme 2 radiosynthesis affords tracer [18F]4 in an unoptimized, 6.5% decay corrected radiochemical yield based on 7, in >99% purity, and a specific activity of ∼2100 Ci/mmol (avg, n = 10). Rodent intravenous (i.v.) tail vein microdoses of [18F]4 (0.8–1.2 mCi; ∼115–258 ng of tracer mass in 0.5 mL formulated dose volumes) were prepared using an excipient combination of 1:10 acetonitrile/phosphate buffered saline (PBS), pH 7.4. The average time from the start of synthesis to dose injection was 1.5 h (n = 10), which is a time frame slightly less than one-half-life of the fluorine-18 isotope (t1/2 = 110 min). Although the current radiosynthesis routinely affords three rodent imaging doses per run, studies are ongoing to improve Scheme 2 radiochemical yield by optimization of the microwave-assisted coupling conditions of 6 and 7 to provide enhanced dose quantities. Additionally, alternate approaches to [18F]4 are being explored that obviate the need for prosthetic group 7.
Determinations of the CNS in vivo penetration and distribution profiles of [18F]4 were performed by i.v. tail vein injection in anesthetized young adult male rats, followed by microPET scanning for 120 min. The PET imaging was performed in parallel with magnetic resonance (MR) and microcomputed axial tomography (CT) scanning. The coregistration of the MR and CT data provided correlated anatomical tissue information allowing for accurate three-dimensional definitions of cerebral regions of interest (ROIs) relative to established rat brain atlas designations.16 Various amounts of regional radioactivity signals were determined as standard uptake values (SUV, per Methods section)17 that allowed for tracer performance comparisons across rat subjects, and subsequently permitted the determinations of average (n = 3) CNS radioactivity signal values ± standard error measures (SEM) per ROI over time.
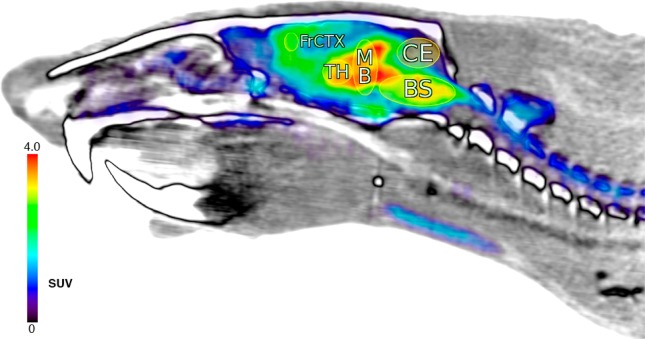
Representative average cerebral SUV radioactivity profiles as a function of time are shown in the time-activity curves of Figure 2. The curves include key brain ROIs for: hind brain/brain stem (BS), caudate-putamen (CP), cerebellum (CE), frontal cortex (FrCtx), midbrain (MB), and thalamus (TH). The administration of [18F]4 alone (baseline scans) provided Figure 2 tracer cerebral penetration and distribution ROI profiles shown as the solid line curves at >1.0 SUV. These curves reveal fast radioactivity brain uptake within 5–10 min after tracer injection. Significant radioactive signals (≥2.0 SUV) are found in all of the ROIs between 0 and 30 min post tracer injection. Thus, [18F]4 readily penetrates brain after i.v. administration, which is consistent with the theoretical log P profile of compound 4 (cLogP ∼ 1.1).7,18,19 A representative image of one of the rats per Figure 2 baseline tracer time-activity analysis is shown in Figure 3, presented as a summed radioactivity sagittal brain view with defined two-dimensional cerebral ROIs.
Figure 2.
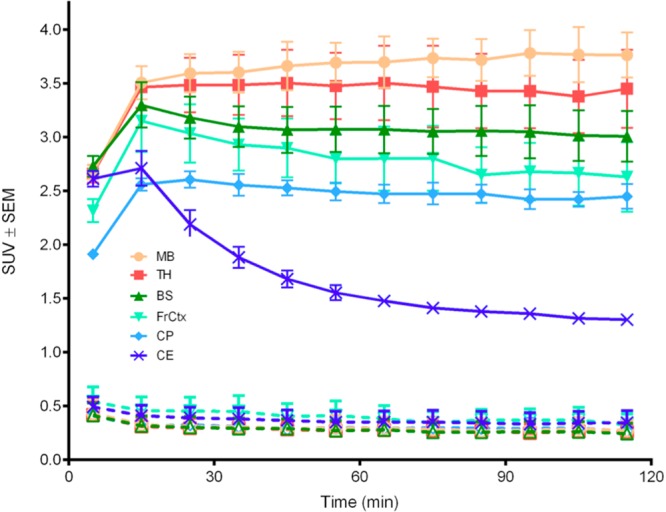
Averaged (n = 3) decay-corrected, subject normalized (SUV), radioactivity versus time curves in rat brain with standard error measure bars determined after i.v. injection of tracer [18F]4: solid lines from baseline (tracer alone) scans; broken lines from challenged scans (nonradioactive 4, 2.0 mg/kg, 10 min prior to tracer; see the Supporting Information for an expanded Y-axis plot of these challenge curves); with select regions of interest defined per the legend as hind brain/brain stem (BS), caudate-putamen (CP), frontal cortex (FrCtx), midbrain (MB), TH thalamus (TH), and cerebellum (CE).
Figure 3.
Rat sagittal brain and partial spine view (anterior left, posterior right; −0.57 mm from midline) of coregistered PET (colored) and CT (white, gray, black) data; with PET radioactivity averaged over all time frames (0–120 min) post [18F]4 i.v. injection (1.14 mCi), displayed using NIH color table (0.0–4.0 SUV global thresholds); cerebral regions shown as ellipses and labeled per Figure 2 definitions.
Per Figure 3, little or no radioactivity is detected in skull or bone between 0 and 120 min. This suggests that the liberation of [18F]fluoride ion from [18F]4 does not readily occur within the 120 min scan time. Otherwise, if any free [18F]fluoride ion was present then it would have been rapidly assimilated into bone matrix affording signal.20 Our initial interpretation of the lack of bone and skull radioactivity is that the [18F]β-fluoroethoxy fragment of [18F]4 remains intact in vivo during scanning. We are currently assessing whether this observation might also indicate that an in vivo [18F]4-AChE adduct formed might have a favorable lifetime within the 120 min scan period, relative to subsequent Scheme 1 adduct reactivation or aging processes.
The Figure 2 baseline solid line curves and Figure 3 perspective demonstrate differential regional radioactivity ROI signal distribution profiles in brain after [18F]4 is injected. For example, at 60 min post injection highest signals are observed in the midbrain, thalamus and brain stem with somewhat lower signals in the frontal cortex and caudate-putamen. The lowest signal is found in the cerebellum. All ROIs except the cerebellum show constant radioactivity signals by 30 min that remain to 120 min. The cerebellum radioactivity decreases over time from its maximum at 10–15 min post injection to a moderate signal level after 90 min. Similar baseline time-activity profiles characterized with early maxima and then reduced moderated radioactivity signals by 90 min were also observed within select peripheral tissues, as shown in Figure 4. The observation that Figure 2 baseline CNS time-activity signals become constant at later times suggests the formation of an OP inhibited AChE adduct; i.e., [18F]4-AChE. Additionally, Figure 2 relative amounts of radioactivity per ROI are consistent with relative regional cerebral rat AChE densities determined by traditional ex vivo histochemical measures21,22 and non-OP tracer AChE PET imaging.23−25
Figure 4.
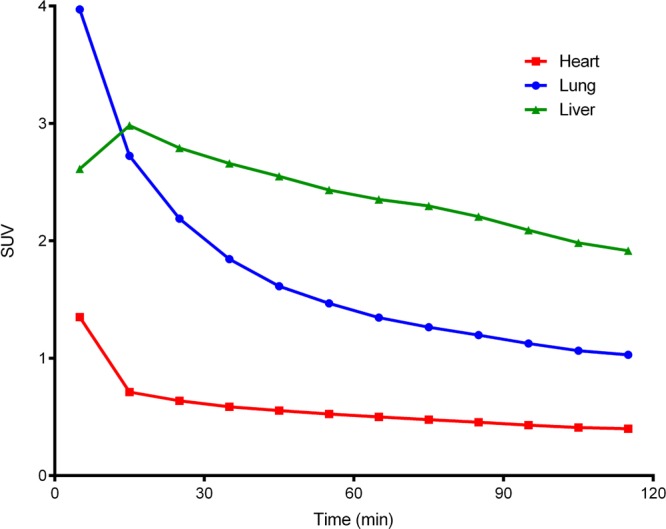
Typical radioactivity (decay corrected and subject normalized as SUV) versus time curves for select peripheral rat tissues (heart, lung and liver; per legend) after administration of 1.8 mCi of [18F]4.
Challenged PET imaging experiments were performed in order to appraise the degree to which regional cerebral signals could be blocked by a competing nonradioactive (cold) AChE inhibitor ligand. Cold ligand 4 was used for the blocking experiments, since it is an agent exemplified as [18F]4 that readily penetrates brain, and 4 is only slightly less effective than paraoxon as a rat brain AChE inhibitor.7 The 26-fold weaker in vitro rat brain inhibition of AChE by 4 as compared to paraoxon7 was considered an asset for the challenge experiments for reducing the possibility of adverse effects from the blocking doses. Pretreatment of rats with 2.0 mg/kg of nonradioactive 4, 10 min prior to injection of [18F]4, resulted in significant losses of radioactivity in all cerebral ROIs (Figure 2, broken line curves, ≤ 0.5 SUV activity levels; see the Supporting Information for an expanded Y-axis SUV view of the challenge curves) relative to their respective baseline signal levels (solid line curves). These observations suggests that cold ligand 4 pretreatment most likely forms a nonradioactive OP 4-AChE adduct, which diminishes the opportunity for the subsequent generation of the isotopic [18F]4-AChE adduct by the administration of tracer. Presently, the cause(s) of the remaining ≤0.5 SUV activity levels from the challenge experiments remain less clear. Since AChE is found on red blood cells, it is possible that this low signal could be attributed to a radiolabeled fraction of the circulating blood pool.4,5 Additional tissue and blood blocking studies, utilizing other AChE inhibitor blocking agents and other types of esterase inhibitor compounds, are in progress to further define this low radioactivity tissue level.
Conclusion
We sought to address a long-standing need to gain deeper insights into organophosphate CNS tissue penetration and distribution profiles in live animals and to better understand dynamic OP interactions at the target enzyme acetylcholinesterase. Until now, a fluorine-18 labeled OP tracer for dynamic PET imaging in live mammals had yet to be described. The [18F]4 PET tracer was designed as a hybrid structure that takes into account key phosphorus atom functional groups present in select insecticides and nerve agents, including a β-fluoroethoxy moiety that was recently discovered in our laboratories. The radiosynthesis of [18F]4 utilizes a fluorine-18 prosthetic group coupling approach, affording tracer in suitable quantities for rodent microPET imaging studies. The PET imaging utility of the tracer [18F]4 was demonstrated in vivo within rats, in the absence and presence of the nonradioactive 4 challenge agent. Tracer [18F]4 quickly and effectively penetrates brain, and distributes affording different regional brain radioactivity signal levels after 90 min at cerebral locations with known target AChE enzyme densities. At later times post injection, constant CNS pharmacokinetic profiles are observed that are consistent with the expected formation of an [18F]4-AChE adduct. This is the first 18F-labeled organophosphate AChE inhibitor tracer reported. Based on the initial favorable in vivo CNS qualities demonstrated by [18F]4 in rats, studies addressing radiosynthesis improvements and additional in vivo appraisals are ongoing. Those results will be reported in due course. Exploitation of this novel dynamic OP PET imaging technology will satisfy a contemporary need to comprehensively probe organophosphate in vivo mechanisms of action over time. The fluorine-18 half-life is considered a tracer asset that is expected to aid the assessments of CNS OP-AChE adduct fates with PET imaging under native and various therapeutic conditions.
Methods
Radiosynthesis and Dose Preparation
The Scheme 2 radiosynthesis of [18F]4 used the precursor 6 that was described previously.7 Reagents and solvents such as acetonitrile, ethyl acetate, hexanes, and cesium carbonate (Cs2CO3) were reagent grade or better, used without any additional purification, and were purchased from Aldrich Chemical Co. (Milwaukee, WI). USP grade PBS, pH 7.4, was purchased from Sigma-Aldrich Chemical Co. High performance liquid chromatography (HPLC) was performed with a Waters 590 system (Milford, MA) coupled to a Shimadzu SPD UV–visible detector (Columbia, MD) and a gamma counting in-line radiation flow detector (Model 105s, CRA; Berkeley, CA). The HPLC data was collected with a SRI Peaksimple, model 304, data system (Torrance, CA).
The high specific activity 2-[18F]fluoroethyl-1-(4-methyl)benzenesulfonate 7 was prepared according to established literature methods,13,14 using [18F]fluoride ion generated with a GE PETtrace medical cyclotron and the 1,2-bis-tosyloxyethane, 8. In a typical experiment, a distilled water (10 mL) preconditioned anion exchange resin cartridge (ORTG, Inc.; Oakdale,TN) was loaded with ∼400 mCi of [18F] fluoride ion, rinsed with distilled water (2 mL), and then eluted with a 1 mL volume of a 1:99, water/cetonitrile solution, containing potassium carbonate (K2CO3, 10 mg) and Kryptofix222 (64 mg). The eluate (∼330 mCi of activity) was placed in a 4 mL flat-bottomed glass vial and the water portion was removed by azeotrope distillation using acetonitrile under vacuum and then a nitrogen gas stream. Reagent 8 (1.0 mg) was dissolved in 0.25 mL of acetonitrile, and this solution was added to the dried radioactive residue. The vial was sealed with a Teflon cap, heated at 75 °C for 5 min, and then allowed to cool to room temperature. A radioactive TLC was performed (silica gel, elution with 3:2 ethyl acetate/hexanes), confirming >98% [18F]fluoride ion incorporation and the presence of a radioactive band that coeluted with the nonradioactive (cold) form of 7. The 0.25 mL reaction solution of 7 was subsequently transferred to a Biotage 0.2–0.5 mL Pyrex microwave reaction vessel that contained powdered Cs2CO3 (3.3 mg), precursor 6 (6.2 mg), and activated 4 Å, 8–12 mesh (J.T. Baker) molecular sieves (4–6 individual sieves used). The vessel was sealed with a nonmetal crimp top, and then placed in a Biotage (Charlotte, NC) Initiator 8 microwave reactor unit. The vessel was subjected to microwave radiation at 130 °C, 400 W initial power, which then stabilized to 70 W over the course of 10 min. Thereafter, the vessel contents were allowed to cool to room temperature. The crude material was purified by semipreparative normal phase HPLC (60:40 EtOAc/hexane, Phenomenex Luna 10 μm silica column 250 × 10 mm, flow rate 4 mL/min). The major radioactive peak containing [18F]4 was collected beginning at ∼18.0 min elution time. The solvent of the collected tracer fraction was removed under a stream of nitrogen gas. The resultant residue was formulated as 0.8–1.8 mCi rat doses by dissolving portions of the residue in a mixture of 0.05 mL acetonitrile and 0.45 mL of PBS, pH 7.4. The 1:9 acetonitrile/PBS dose formulation was used based on previous studies where cold 4 was found to have enhanced stability in this solution, relative to similar solutions of ethanol- or acetone-based dose formulations.7 Additionally, in other experiments, no apparent adverse events have been observed during ≥2 h after the administration ≤1 mL of 1:9 acetonitrile/PBS devoid of OP material in rats. The average decay corrected radiochemical yield of [18F]4 was 6.5% (n = 10), based upon reagent 7. The average total synthesis time from the start of synthesis to completion of the dose formulation was 150 min (n = 10).
Before animal dosing, quality control (QC) analytical HPLC was performed (60:40 EtOAc/hexane, Phenomenex Luna 10 μm silica column 250 × 4.6 mm, flow rate 1 mL/min). The QC HPLC radioactivity peak at ∼7.5 min possessed the same retention time as the nonradioactive (cold) ligand standard 4 (UV detection) demonstrating that the tracer [18F]4 was >99% pure. To determine specific activity, a standard curve was constructed using the areas under the analytical HPLC 254 nm peak for cold compound 4 standard, in which known concentrations of 4 (five or more concentrations at 1–0.01 mg/mL, run in triplicate) were evaluated. Aliquots of either the nonradioactive standard or the tracer [18F]4 were subjected to analytical HPLC (75:25 EtOAc/hexane, Phenomenex Luna 10 μm silica column 250 × 4.6 mm, flow rate 1 mL/min). The areas under the UV peaks for tracer [18F]4 were interpolated against the standard curve to determine the mass of [18F]4 from which specific activity (radioactivity/mass; Ci/mmol) was calculated. The average specific activity of tracer [18F]4 at the time of injection was calculated as ∼2100 Ci/mmol (n = 10).
Since [18F]4 is a radioactive organophosphate administered at microdoses (∼115–258 ng of mass), protective care should be taken when handling the tracer since its toxicological profile is not comprehensively defined.
Rat MicroPET/CT and MR Imaging
Male Sprague–Dawley rats (250–600 g) were used for the imaging studies. The animals were cared for and used at the University of California, San Francisco (UCSF) facilities that are accredited by the American Association for Accreditation of Laboratory Animal Care (AAALAC). The imaging studies were performed by adhering to UCSF IACUC approved protocols that satisfied NIH guidelines and institutional regulations. All doses (0.5 mL) were administered as intravenous (i.v.) bolus injections into the tail vein, followed by a 0.3 mL saline flush. The challenged PET imaging experiments with nonradioactive 4 were accomplished by giving the blocking agent (2 mg/kg; formulated in acetonitrile:PBS, pH 7.4; 1:9) 10 min prior to tracer. The PET, CT, and MR imaging were performed northermic (37 °C) under isoflurane anesthesia (1–1.5%). The PET and CT imaging data were acquired with a Siemens Inveon microPET/CT scanner system (ca. 1.5 mm PET imaging spatial resolution). Dynamic PET imaging data were acquired over 120 min beginning ∼1 min after the time of injection of tracer [18F]4. The PET data were reconstructed with using a Siemens Inveon reconstruction program suite, including OSEM3D followed by MAP or FastMAP; as 12 frames, 600 s per frame for the 120 min scans, decay time corrected, and quantified with a radiation phantom instrument calibration factor. A partial volume correction was not applied, and conservative ROI definitions were used as described below. The CT data were acquired in standard rat mode: 80 kVp, 225 mA; 400 ms exposure, 194 steps × 194 degrees, and 97 μm isotropic resolution. The MR data were acquired with a Bruker Biospin 7-T magnet, using a multislice 2D FLASH protocol with the following parameters: T2*-weighted gradient recall echo, TR = 1528.3 ms, TE = 7 ms, and 256 × 256 × 50 voxels, affording 16 μm3 resolution.
The reconstructed MR, CT and PET imaging data files were processed with AMIDE open source software26 (SourceForge), version 1.0.4. The MR and CT images were oriented as defined by Paxinos.16 Cranial landmarks of bregma and lambda were identified from the CT images. The X, Y, Z coordinates of imaging views were centered at bregma, equivalent to the origin of the first scan, and then consistent landmark structures were iteratively coregistered and template fit against the cranial structures of the first scan landmarks. Subsequently, the landmarks were correlated with cerebral soft tissues from the MR scans.
The coregistered imaging data permitted ROIs described in Figures 2 and 3 to be defined within their ROI volume size limits and locations, and against established stereotaxic three-dimensional locations.16 Cerebral ROIs were drawn conservatively, thereby avoiding the inclusion of spillover radioactivity contributions from nearby tissues, and thus, it is possible that the activity values per ROI might be slightly underestimated. The CNS ROIs were defined as follows: BS as hind brain/brain stem, CP as caudate-putamen, FrCtx as frontal cortex, MB as midbrain, TH as thalamus, and CE as cerebellum. PET scan regional tissue radioactivity is reported as standardized uptake value (SUV) defined as [activity concentration in the tissue region of interest (MBq/cc)/decay corrected injected dose at time = 0 (MBq)] × body weight of the rat as gram (g).17 No attempt was made to correlate the imaging-derived ROI time–activity curve data to traditional (sacrifice, tissue collection, and counting) biodistribution activity profiles. ROI PET scan statistics (SUV ± SEM) collected from time points at midframe were exported to the open source software LibreOffice Calc (Document Foundation), and plots of SUV versus time were generated using GraphPad Prism software (La Jolla, CA).
Acknowledgments
We are grateful for the expert technical guidance of Dr. J. D. Rowland of the Center for Molecular and Genomic Imaging at the University of California, Davis.
Glossary
Abbreviations
- ACh
acetylcholine
- AChE
acetylcholinesterase
- PBS
phosphate-buffer saline
- PET
positron emission tomography
- PNP
para-nitrophenoxy
- OP
organophosphate
- ROI
region of interest
Supporting Information Available
Expanded Y-axis view of Figure 2 challenged (broken lines) time–activity curves in rat brain. This material is available free of charge via the Internet at http://pubs.acs.org.
Author Contributions
C.M.T. and J.M.G designed the tracer; S.K.A. and Y.B. prepared the radiolabeling precursors and nonradioactive tracer standards; S.L.J., H.F.V., and J.M.G. developed the radiosynthesis; S.M. and S.L.J. performed the rodent imaging; and M.R.B. with J.M.G. performed the PET imaging analyses.
We are grateful for support from the NIH. The investigation was supported by the National Institutes of Health (NIH), primarily by Grant R21 NS072079, and to a minor extent by Award P30 NS055022.
The authors declare no competing financial interest.
Funding Statement
National Institutes of Health, United States
Supplementary Material
References
- Eto M. (1974) Organophosphorus Pesticides: Organic and Biological Chemistry, CRC Press, Cleveland, OH. [Google Scholar]
- Ballantyne B., and Marrs T. C. (1992) Clinical and Experimental Toxicology of Organophosphates and Carbamates, Butterworth Heinemann, Boston, MA. [Google Scholar]
- Fest C., and Schmidt K. J. (1973) The Chemistry of Organophosphorus Pesticides: Reactivity, Synthesis, Mode of Action, Toxicology, Springer Verlag, New York. [Google Scholar]
- Bajgar J. (2004) Organophosphates/Nerve Agent Poisoning: Mechanism of Action, Diagnosis, Prophylaxis and Treatment. Adv. Clin. Chem. 38, 151–216. [DOI] [PubMed] [Google Scholar]
- Bajgar J.; Kuca K.; Jun D.; Bartosova L.; Fusek J. (2007) Cholinesterase Reactivators: the Fate and Effects in the Organism Poisoned with Organophosphate/Nerve Agents. Curr. Drug Metab. 8, 803–809. [DOI] [PubMed] [Google Scholar]
- Zaganas I.; Kapetanaaki S.; Mastorodemos V.; Kanavouras K.; Colosio C.; Wilks M. F.; Tsatsakis A. M. (2013) Linking Pesticide Exposure and Dementia: What is the Evidence?. Toxicology 307, 3–11. [DOI] [PubMed] [Google Scholar]
- Ahmed S. K.; Belabassi Y.; Sankaranarayanan L.; Chao C. K.; Gerdes J. M.; Thompson C. M. (2013) Synthesis and Anti-acetylcholinesterase Properties of Novel β- and γ-substituted Alkoxy Organophosphonates. Bioorg. Med. Chem. Lett. 23, 2048–2051. [DOI] [PMC free article] [PubMed] [Google Scholar]
- Francis P. T.; Palmer A. M.; Snape M.; Wilcock G. K. (1999) The Cholinergic Hypothesis of Alzheimer’s Disease: A Review of Progress. J. Neurol. Neurosurg. Psychiatry 66, 137–147. [DOI] [PMC free article] [PubMed] [Google Scholar]
- Volkow N. D.; Dind Y.-S.; Fowler J. S.; Gately S. J. (2001) Imaging Brain Cholinergic Activity with Positron Emission Tomography: Its Role in the Evaluation of Cholinergic Treatments in Alzheimer’s Dementia. Biol. Psychiatry 49, 211–220. [DOI] [PubMed] [Google Scholar]
- Shinotoh H.; Fukushi K.; Nagatsuka S. I.; Irie T. (2004) Acetylcholinesterase Imaging: Its Use in therapy Evaluation and Drug Design. Curr. Pharm. Design 10, 1505–1517. [DOI] [PubMed] [Google Scholar]
- Kikuchi T.; Okamura T.; Fukushi K.; Takahashi K.; Toyohara J.; Okada M.; Zhang M. R.; Irie T. (2007) Cerebral Acetylcholinesterase Imaging: Development of the Radioprobes. Curr. Top. Med. Chem. 7, 1790–1799. [DOI] [PubMed] [Google Scholar]
- Prenant C.; Couzel C. (1990) Synthesis of [11C]-Sarin. J. Label. Compd. Radiopharm. 28, 645–651. [Google Scholar]
- Herth M. M.; Kramer V.; Rosch F. (2009) Synthesis of Novel WAY 100635 Derivatives Containing a Norbornene Group and Radiofluorination of [18F]AH1. MZ as a Serotonin 5-HT1A Receptor Antagonist for Molecular Imaging. J. Label. Compd. Radiopharm. 52, 201–207. [Google Scholar]
- Musachio J. L.; Shah J.; Pike V. W. (2005) Radiosyntheses and Reactivities of Novel [18F]2-Fluoro-ethyl Arylsulfonates. J. Label. Compd. Radiopharm. 48, 735–747. [Google Scholar]
- Lu S.-Y.; Chin F. T.; McCarron J. A.; Pike V. W. (2004) Efficient O- and N-(β–Fluoroethylation) with NCA [18F] β-Fluroethyl Tosylate Under Microwave-enhanced Conditions. J. Labelled Compd. Radiopharm. 47, 289–297. [Google Scholar]
- Paxinos G., and Watson C. (2007) The Rat Brain in Stereotaxic Coordinates, 25th ed., Academic Press, Burlington, MA. [Google Scholar]
- Innis R. B.; Cunningham V. J.; Delforge J.; Fujita M.; Gjedde A.; Gunn R. N.; Holden J.; Houle S.; Huang S. C.; Ichise M.; Iida H.; Ito H.; Kimura Y.; Koeppe R. A.; Knudsen G. M.; Knuuti J.; Lammertsma A. A.; Laruelle M.; Logan J.; Maguire R. P.; Mintun M. A.; Morris E. D.; Parsey R.; Price J. C.; Slifstein M.; Sossi V.; Suhara T.; Votaw J. R.; Wong D. F.; Carson R. E. (2007) Consensus Nomenclature for in vivo Imaging of Reversibly Binding Radioligands. J. Cereb. Blood Flow Metab. 27, 1533–1539. [DOI] [PubMed] [Google Scholar]
- Ghose A. K.; Crippen G. M. (1987) Atomic Physicochemical Parameters for Three-Dimensional-Structure-Directed Quantitative Structure-Activity Relationships. 2. Modeling Dispersive and Hydrophobic Interactions. J. Chem. Inf. Comput. Sci. 1, 21–35. [DOI] [PubMed] [Google Scholar]
- Broto P.; Moreau G.; Vandycke C. (1984) Molecular Structures: Perception, Autocorrelation, Descriptor, and SAR Studies. Systemic of Atomic Contributions for the Calculation of the n-Octanol/Water Partition Coefficients. Eur. J. Med. Chem. 19, 71–78. [Google Scholar]
- Ametamey S. M.; Honer M.; Schubiger P. A. (2008) Molecular imaging with PET. Chem. Rev. 108, 1501–1516. [DOI] [PubMed] [Google Scholar]
- Biegon A.; Wolff M. (1986) Quantitative Histochemistry of Acetylcholinesterase in Rat and Human Brain Postmortem. J. Neurosci. Methods 16, 39–45. [DOI] [PubMed] [Google Scholar]
- Segal M.; Greenberger V.; Israeli M.; Biegon A. (1988) A Correlation Between Regional Acetylcholinesterase Activity in Rat Brain and Performance in a Spatial Task. Behav. Brain. Res. 30, 215–219. [DOI] [PubMed] [Google Scholar]
- Planas A. M.; Crouzel C.; Hinnen F.; Jobert A.; Ne F.; DiGiamberardino L.; Tavitian B. (1994) Rat brain Acetylcholinesterase Visualized with [11C]Physostigmine. NeuroImage 1, 173–180. [DOI] [PubMed] [Google Scholar]
- Funaki Y.; Kato M.; Iwata R.; Sakurai E.; Tashiro M.; Ido T.; Yanai K. (2003) Evaluation of the Binding Characteristics of [5-(11)C-Methoxy]donepezil in the Rat Brain for in vivo Visualization of Acetylcholinesterase. J. Pharmacol. Sci. 91, 105–112. [DOI] [PubMed] [Google Scholar]
- Ryu E. K.; Choe Y. S.; Park E. Y.; Paik J. Y.; Kim Y. R.; Lee K. H.; Choi Y.; Kim S. E.; Kim B. T. (2005) Synthesis and evaluation of 2-[18F]fluoro-CP-118,954 for the in vivo mapping of acetylcholinesterase. Nucl. Med. Biol. 32, 185–191. [DOI] [PubMed] [Google Scholar]
- Loening A. M.; Gambhir S. S. (2003) AMIDE: A Free Software Tool for Multimodality Medical Image Analysis. Mol. Imaging 2, 131–137. [DOI] [PubMed] [Google Scholar]
Associated Data
This section collects any data citations, data availability statements, or supplementary materials included in this article.


