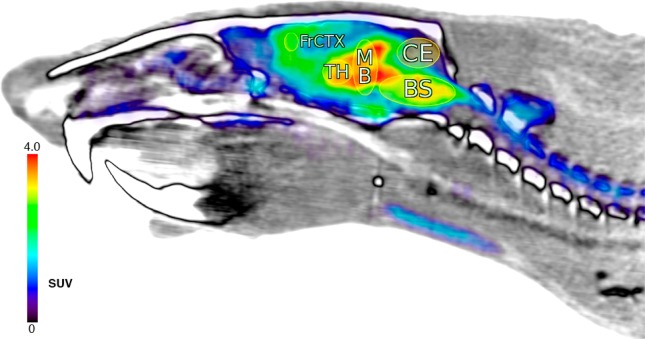
Figure 3.
Rat sagittal brain and partial spine view (anterior left, posterior right; −0.57 mm from midline) of coregistered PET (colored) and CT (white, gray, black) data; with PET radioactivity averaged over all time frames (0–120 min) post [18F]4 i.v. injection (1.14 mCi), displayed using NIH color table (0.0–4.0 SUV global thresholds); cerebral regions shown as ellipses and labeled per Figure 2 definitions.

