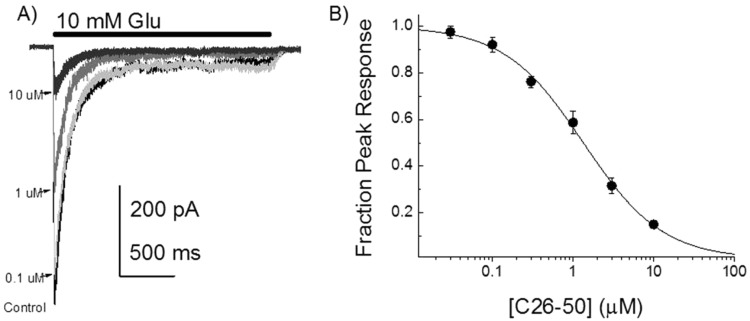
Figure 4.
Inhibition curve of peak GluN1/GluN2A responses by the C26–50 aptamer. (A) Example responses of an outside-out patch containing GluN1/GluN2A receptors to a 2 s application of 10 mM glutamate alone or in the continual presence of the indicated concentration of C26–50 aptamer. (B) Summary of peak inhibition data.

