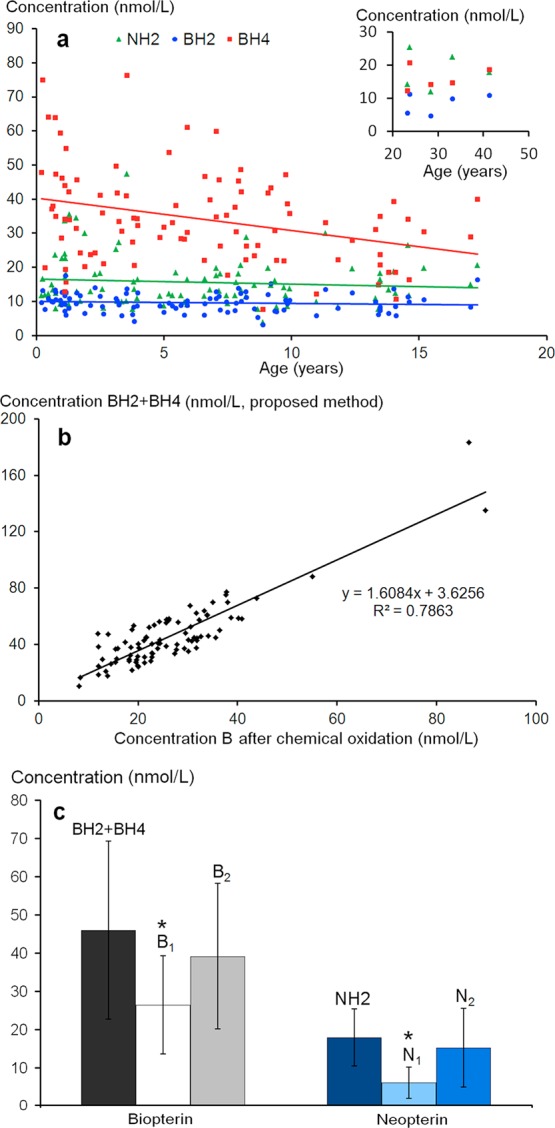
Figure 6.

(a) Relationship between age and BH4 (y = −0.95x + 40.24; R2 = 0.106), BH2 (y = −0.057x + 10.00; R2 = 0.009), and NH2 (y = −0.15x + 16.53; R2 = 0.009) concentrations. (Inset: patients over 20 years.) (b) Comparison between B and N levels in 99 CSF samples determined by the proposed method (BH4 + BH2 = total biopterin) or by off-line chemical oxidation according to ref (25) . (c) Comparison between total biopterin (BH4+BH2) and NH2 as determined with the proposed method (see Figure 4); B1, B2 and N1, N2 refer to biopterin and neopterin levels as determined by offline chemical oxidation after calibration of the method with B and N calibrators or with BH4 and NH2 calibrators, respectively. Asterisk (*) indicates significant difference (p < 0.01) as compared to both methods used to determine (BH4 + BH2, and B1, and NH2, and N1, respectively).
