
Figure 5. Chromatin Patterns of Myogenic Genes.
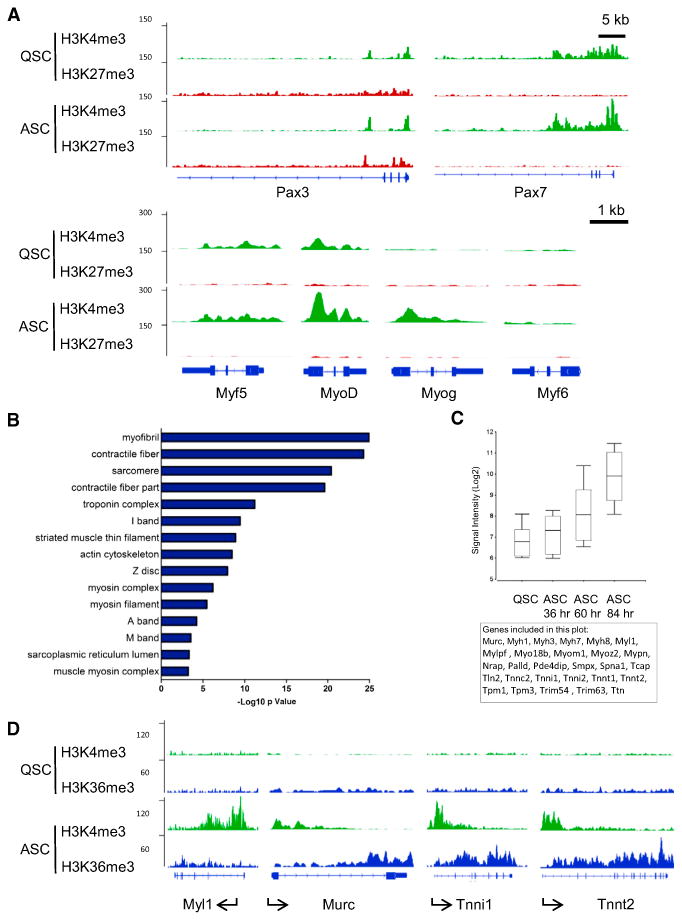
(A) The distribution of H3K4me3 and H3K27me3 at the TSSs of myogenic transcription factors Pax3, Pax7, Myf5, MyoD, Myogenin (Myog), and Myf6.
(B) GO analysis of genes that were neither H3K4me3 nor H3K27me3 in QSCs but acquired H3K4me3 in ASCs.
(C) Box and whisker plot of the expression levels of all genes associated with the GO terms listed in (B).
(D) The distribution of H3K4me3 and H3K36me3 on representative genes associated with the GO terms listed in (B).