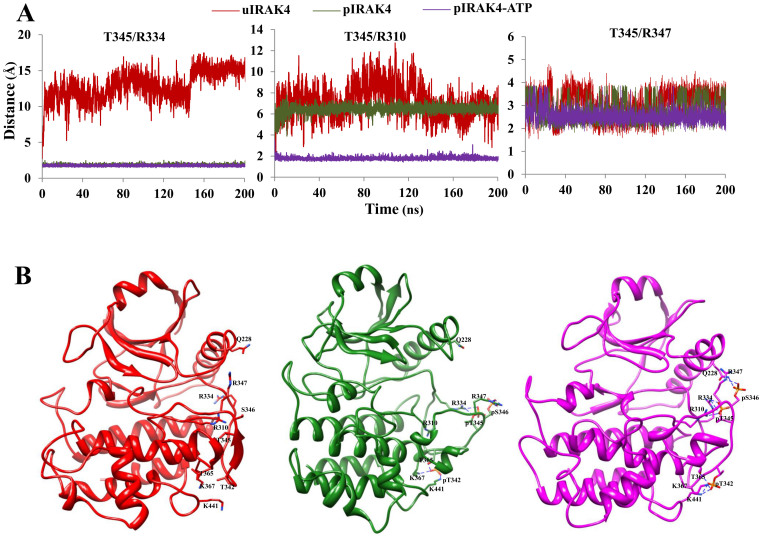
Figure 3. Molecular interaction of T345.
(A) Residue minimum distances of T345/R334, T345/R310, and T345/R347. (B) Apo and ATP-bound IRAK4 KD is shown in ribbon model. Phosphorylation sites and interacting residues are shown in stick model. The hydrogen bond and salt bridge interactions are shown with blue dashes. The color codes are given in the Figure 2 legend.

