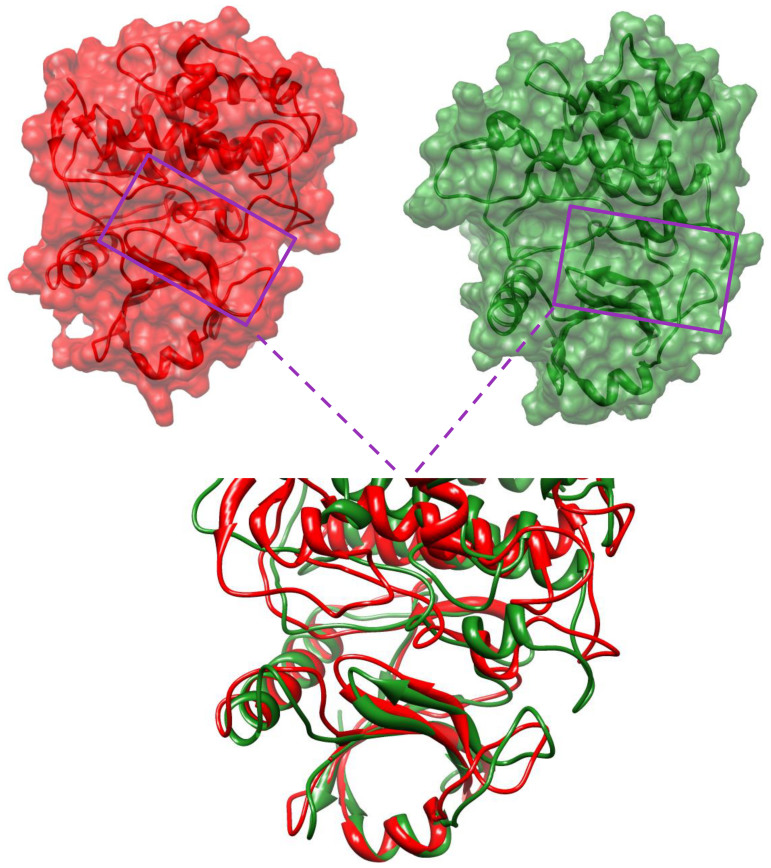
Figure 6. Structural difference in the ATP binding pocket.
Surface and ribbon representation (top) of unphosphorylated and phosphorylated apo structures with ATP binding pocket (magenta rectangle). Structural differences in the ATP binding pocket are shown by superimposing both the apo structures (bottom). Color codes are given in the Figure 2 legend.

