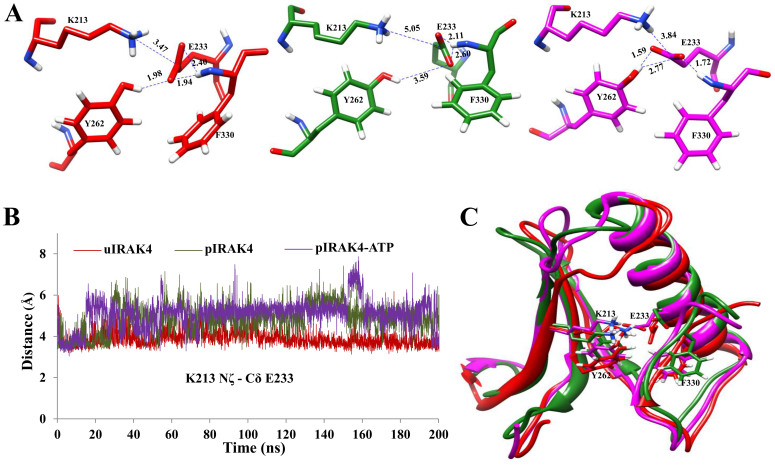
Figure 7. Helix αC orientation.
(A) The structural representation of the key residues and their interactions are shown to understand the helix αC orientation. Atoms are shown in stick representation. (B) The minimum distance is shown between the Nζ of K213 and Cδ of E233. (C) Structural superimposition of the helix αC from apo and ATP-bound structures. Color codes are given in the Figure 2 legend.

