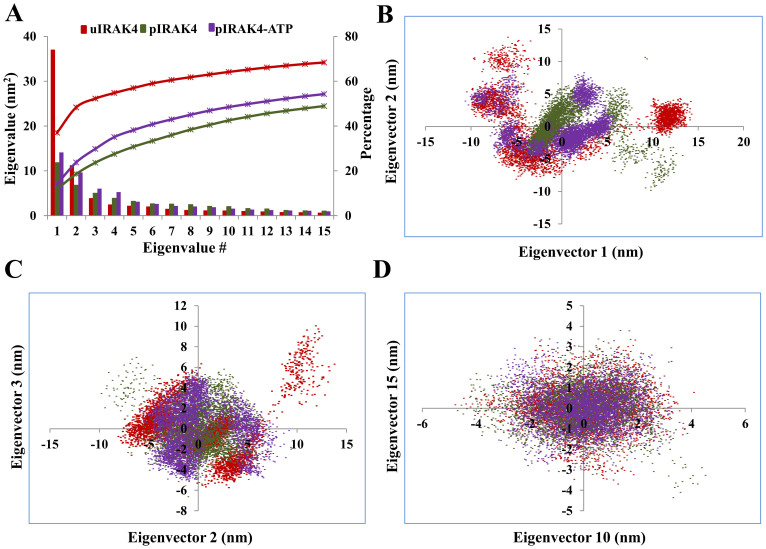
Figure 9. Projection of IRAK4 KD trajectories in phase space.
(A) The first 15 eigenvectors of the covariance matrix and the lines with cross symbol represent the cumulative sum of the contribution to the total fluctuations. The clouds represent the projection of the trajectories of IRAK4 KD (B) eigenvector 1 and 2 (C), eigenvector 2 and 3 (D) eigenvector 10 and 15. We performed the analysis with 50-ps coordinates of the 200-ns trajectory; thus, we used 4000 frames of the trajectory for the projection. The color codes for the clouds are given in the Figure 2 legend.

