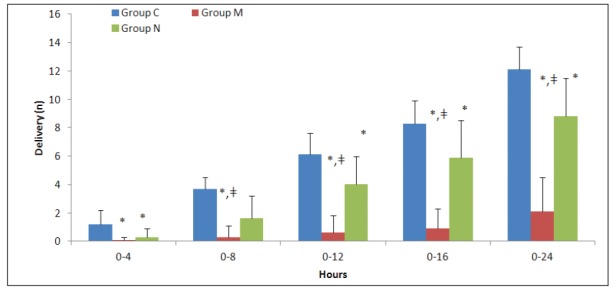
Figure 3. Number of local anesthetic of demands obtained from the patient-controlled epidural analgesia (PCEA) device (mean ± Standard Deviation). *: p<0.01, compared to the control group, ǂ: p<0.01, compared to the neostigmine group, Group C: Control group, Group M: Morphine group, Group N: Neostigmine group.

