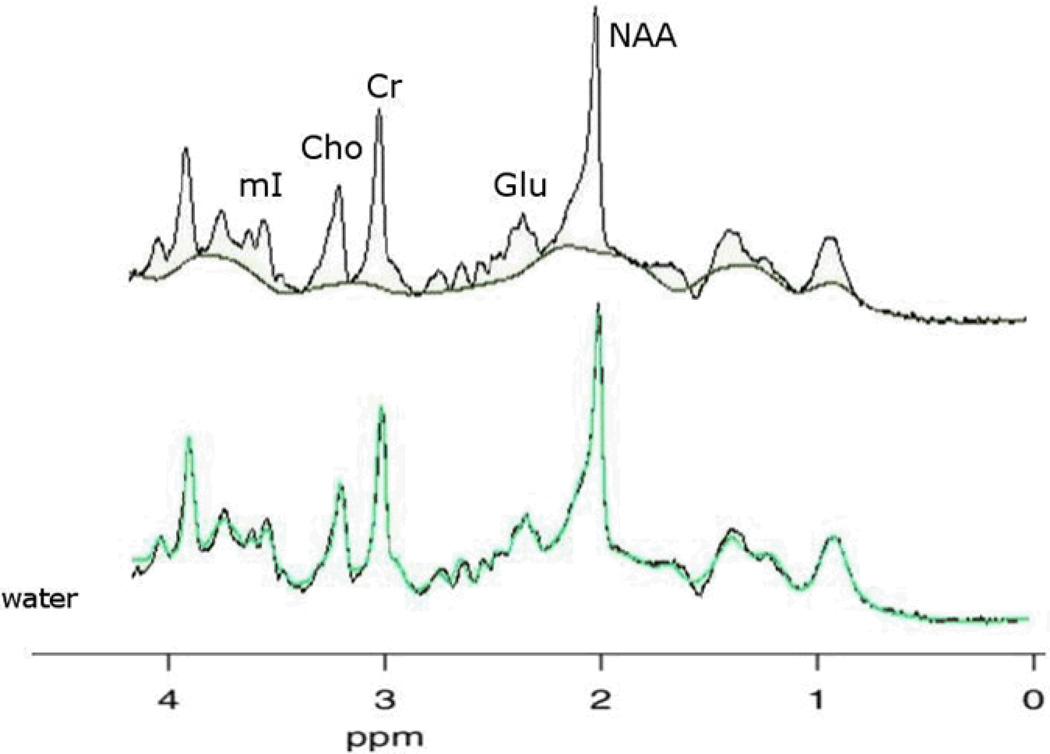
Figure 2.
In vivo spectra of human brain fitted with the SITOOLS software. Top spectrum illustrates a typical good baseline fit between 1.8 and 4.2 ppm. Any peak areas above the baseline are fit by the spectral model, including macromolecules. The bottom spectrum illustrates a typical good model fit. The black line represents the acquired data, the green line the sum of spectral and baseline model used.

