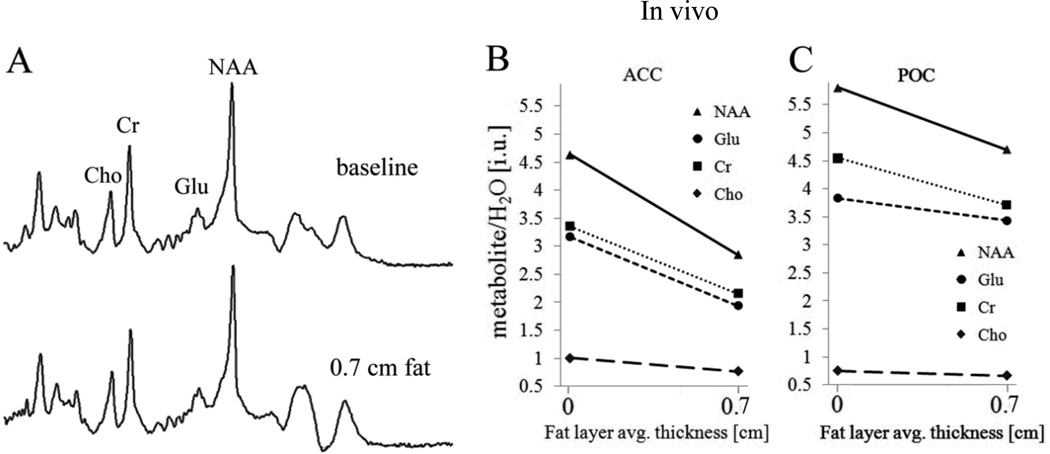
Figure 4.
In vivo brain metabolite spectra for the POC voxel (panel A: spectra are not on the same vertical scale). Plots of NAA/H2O, Glu/ H2O, CR/H2O and Cho/H2O ratios against fat thickness for one participant in ACC (Panel B) and POC (Panel C). (Note: In Panel B, the values for ACC Glu/H2O and Cr/H2O were very similar in one of the participants (participant 2), but for the purpose of clarity, they are shown separated by decreasing the Glu/ H2O values slightly.

