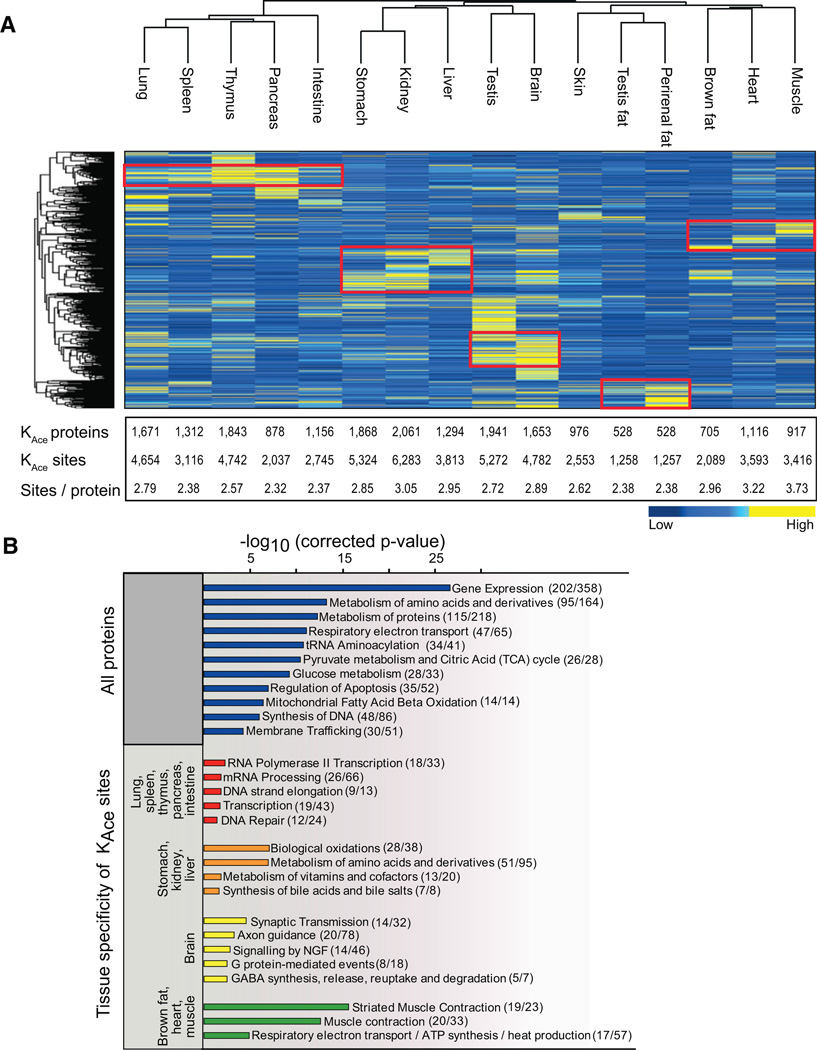
Figure 2. Tissue Distribution of Lysine-Acetylated Proteins.
(A) Hierarchical clustering of the 16 investigated tissues and the identified acetylated proteins based on label-free quantification on their summed MS peptide signal intensities. Low-intensity proteins are depicted in blue, and high-intensity proteins are depicted in yellow. Protein clusters of highly abundant acetylated proteins are highlighted by red boxes. The table summarizes the number of lysine-acetylated proteins and sites identified in each tissue as well as the average number of acetylation sites per protein.
(B) Pathway enrichment analysis for all identified acetylated proteins as well as for acetylated proteins enriched in the main tissue clusters compared to all other tissues. Logarithmized corrected p values for significant overrepresentation are shown. In parenthesis we indicate how many proteins in each pathway we identify to be acetylated.
See also Figure S3.

