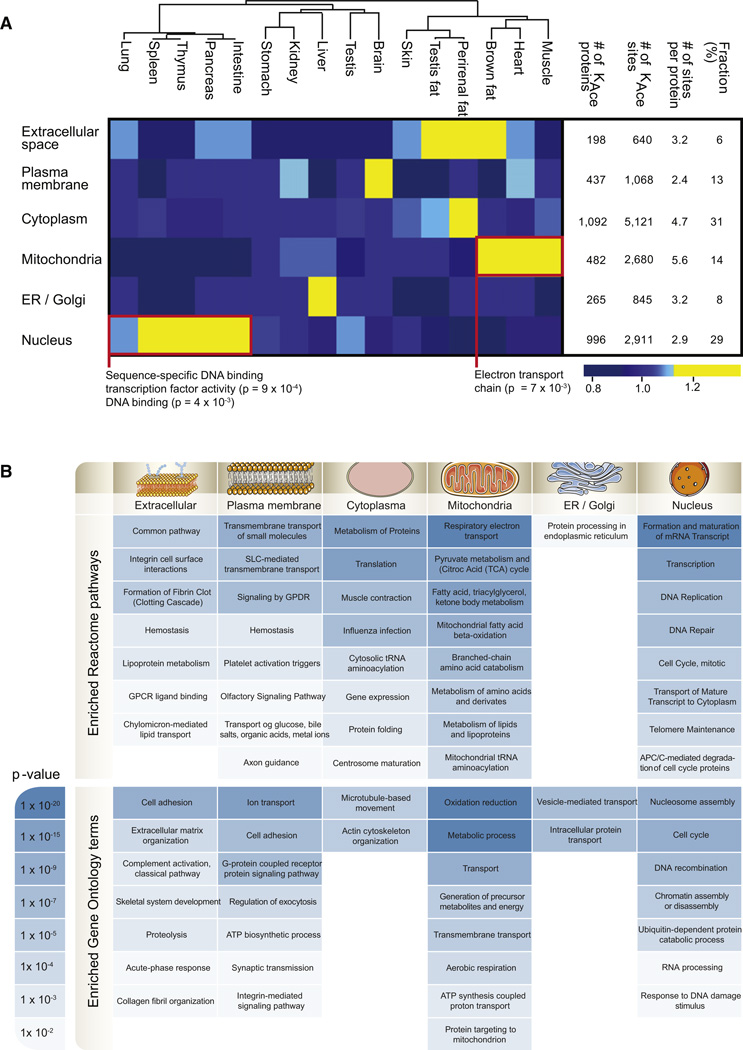
Figure 5. Cellular Compartment Distribution of Acetylated Proteins across Tissues.
(A) All lysine-acetylated proteins were grouped based on their subcellular localization, and for each tissue the fraction of identified acetylated proteins per compartment was calculated. The deviation from the median was visualized as a heatmap according to the indicated color scale. For the clusters encircled by a red box, pathway enrichment analysis was performed, and the protein processes underlying significant overrepresentation is displayed. The number of acetylated proteins and sites per cellular compartment is provided in the table together with the average number of acetylation sites per protein per compartment and the fraction of acetylated proteins per compartment.
(B) GO and pathway enrichment analyses were made for each subcellular compartment, and enriched Reactome pathways and GO terms for biological processes are listed with their corresponding p values color coded according to the scale.
See also Figures S4 and S5.

