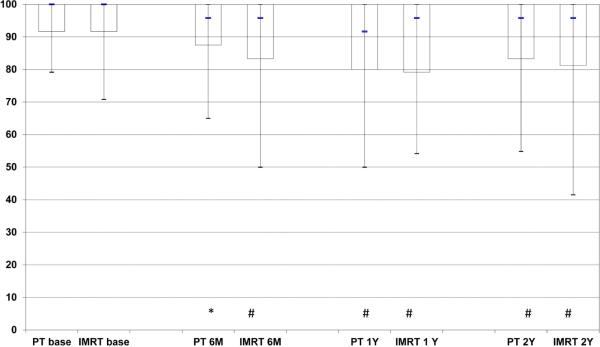
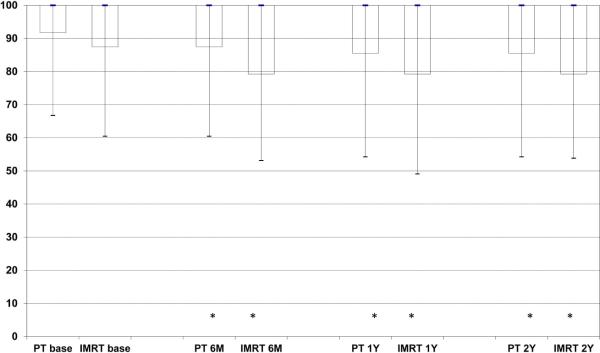
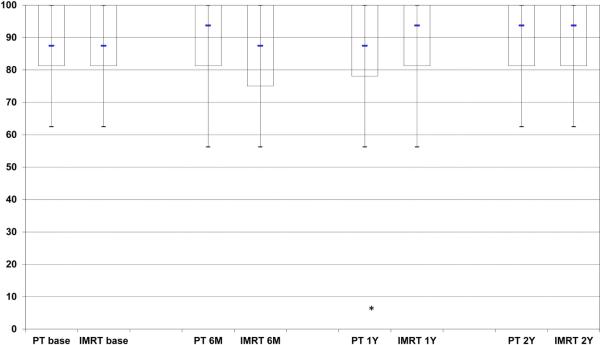
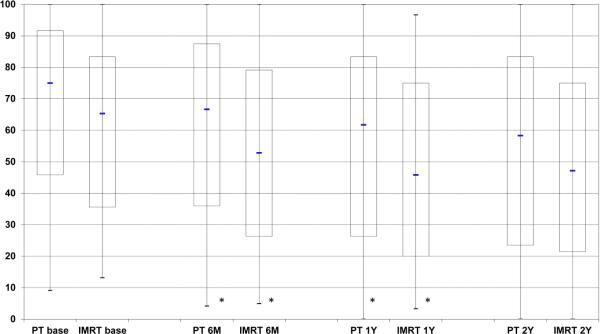
Figure 1.


Expanded Prostate Cancer Index Composite (EPIC) summary scores over time for men treated with intensity-modulated radiotherapy or proton therapy for prostate cancer. Bar and whisker graphs at baseline and 6 months, 1 year, and 2 years after proton therapy or intensity-modulated radiotherapy for A) bowel summary score, B) urinary incontinence score, C) urinary irritative/obstructive score, and D) sexual summary score (no androgen deprivation therapy). The bottom whisker represents the cut-off for the score of the lowest 5%, the bottom bar represents the cut-off score for the lowest quartile, the blue line represents the median score, the top of the bar represents the cut-off for the top quartile, and the top of the whisker represents the cut-off for the score of the top 5%. At the bottom of the graph the asterisk (*) represents a statistically significant change from baseline score for each treatment modality and time point, while a pound sign (#) represents a statistically significant and minimally detectable (>50% of the baseline standard deviation) change from the baseline score.
