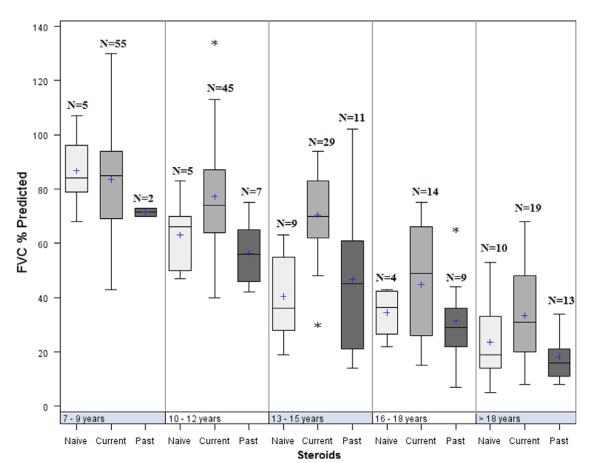
FIGURE 4.
Percent predicted forced vital capacity by age and GC treatment groups. The limits of the box are the 25th and 75th percentile. The median (middle line) and mean (1) are shown within the box. The whiskers are 1.5 times the interquartile length starting from the edge of the boxes; the asterisks are data values of outliers beyond the whiskers. [Color figure can be viewed in the online issue, which is available at wileyonlinelibrary.com.]

