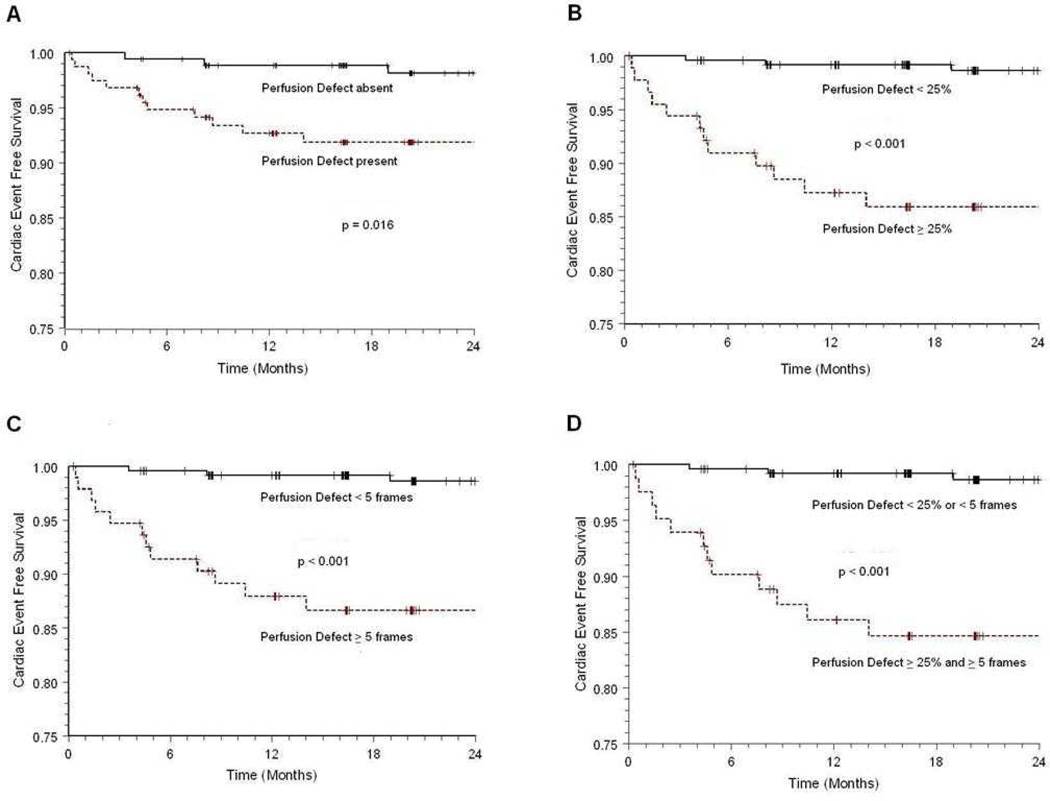
Figure 3. Kaplan-Meier curves demonstrating prognostic risk based on perfusion defect frame duration and defect size.
Kaplan-Meier curve analysis showing the difference in cumulative cardiac event rate when patients are stratified according to the (A) absence or presence of any perfusion defect, (B) absence of a perfusion defect or presence of perfusion defects <25% of the myocardium versus at least one perfusion defect ≥25% of the myocardium, (C) absence of a perfusion defect or presence of perfusion defects <5 frames in duration versus at least one perfusion defect ≥5 frames in duration, and (D) absence of a perfusion defect or presence of perfusion defects <25% of the myocardium or <5 frames in duration versus at least one perfusion defect ≥25% of myocardium and ≥5 frames in duration. Cardiac events were defined as cardiac death, myocardial infarction and unstable angina warranting hospitalization and revascularization.

