
FIGURE 5.
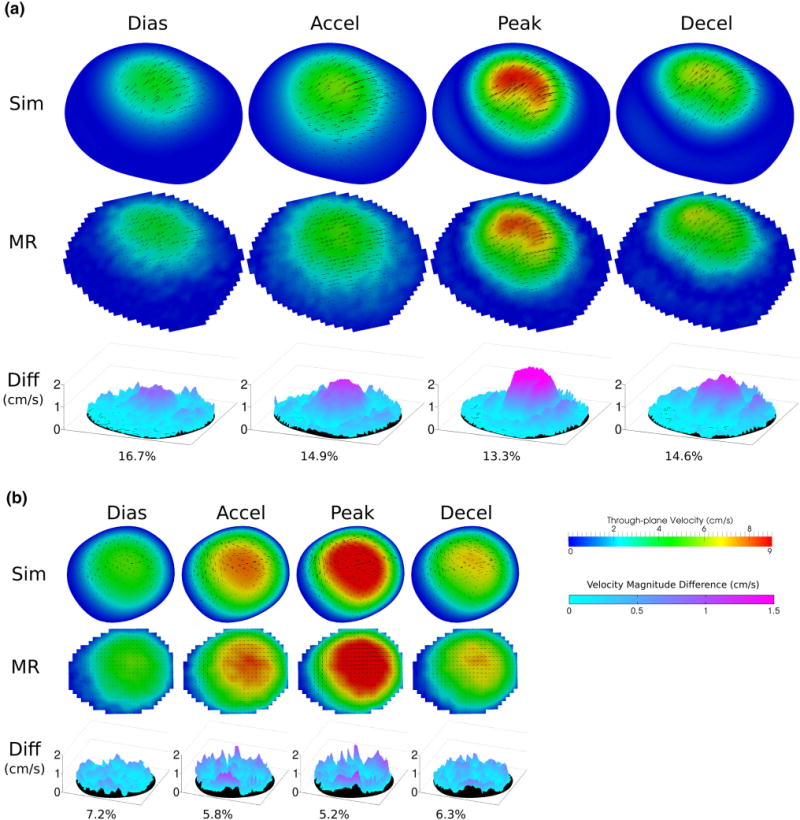
Resting condition flow velocity comparisons: between MR measurements and simulation results at diastole, acceleration, peak, and deceleration time point at slice locations (a) S1 and (b) S2. Color map and arrows correspond to through-plane and in-plane velocities, respectively. Velocity magnitude differences across the slices are shown as 3D surface plots. Percent difference in velocity magnitude averaged across the slice are also shown.