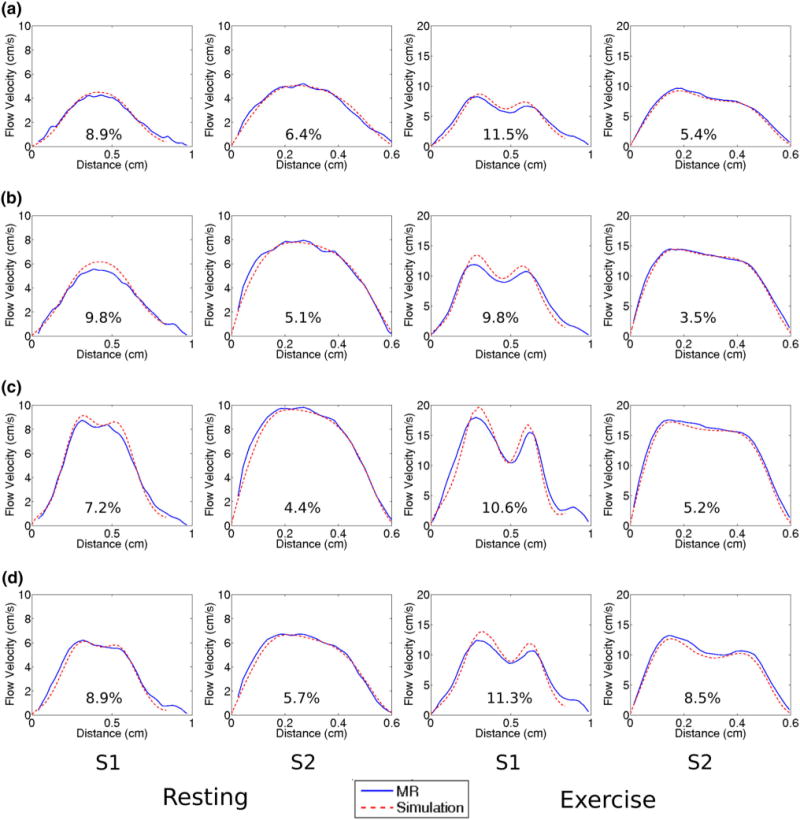
FIGURE 8.

Comparisons of MR and CFD velocity profiles across a line as defined in Fig. 2c at each slice location, at time points (a) diastole, (b) acceleration, (c) peak, and (d) deceleration. Percent difference between MR and CFD averaged across the line are also shown.
