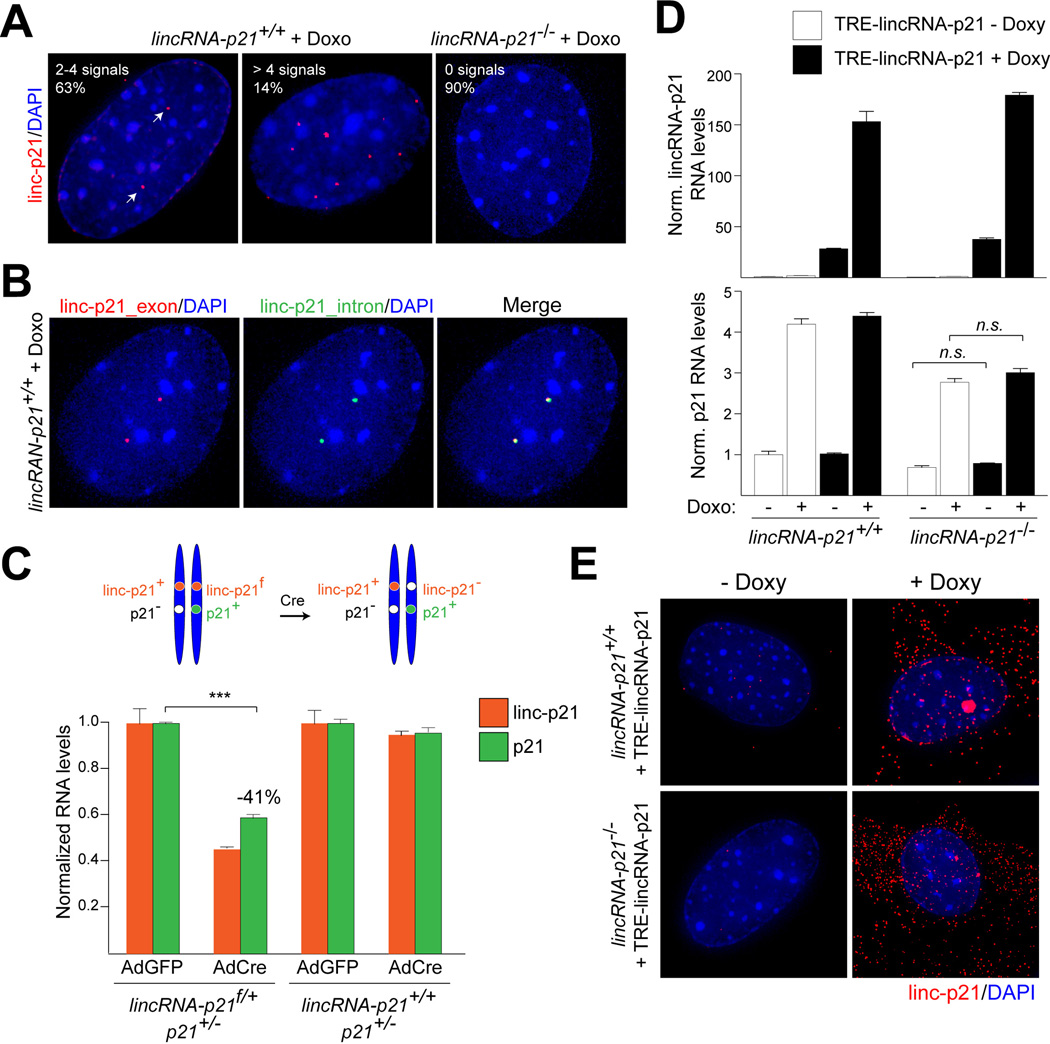
Figure 5. LincRNA-p21 regulates p21in cis.
(A) Single molecule RNA FISH detection of lincRNA-p21 with exon-specific probes in indicated MEFs (white arrows). DNA was counterstained with DAPI. % represents the fraction of cells with indicated number of signals per cell (n=150).
(B) Co-localization of exon- and intron-specific lincRNA-p21 signals using single molecule RNA FISH.
(C) (Top) Schematic. (Bottom) qRT-PCR analysis of lincRNA-p21 and p21 RNA levels in MEFs of indicated genotypes and treatments. Data are represented as mean±SEM, n=3, p<0.0001, paired t-test.
(D) qRT-PCR analysis of lincRNA-p21 (top) and p21 (bottom) RNA levels in MEFs of indicated genotypes, expressing TRE-lincRNA-p21, in the presence or absence of doxorubicin (Doxo) and doxycycline (Doxy). Data, replicated in 2 independent experiments, are represented as mean±SEM of technical replicates.
(E) Single molecule RNA-FISH detection of exogenously expressed lincRNA-p21 in (D).See also Table S4.

