
Figure 2. The effect of ethanol on protein structure: Far-UV (A) and Near-UV (B) CD spectra of 0.65 mg/ml solutions of RNase A.
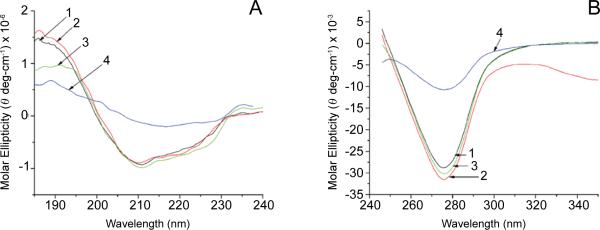
Profile 1: native RNAse A; profile 2: native RNase A incubated under 100% ethanol for 1 week and then rehydrated in phosphate buffer; profile 3: RNase A kept in 10% formaldehyde for 1 week; profile 4: RNase A fixed in 10% formaldehyde, incubated under 100% ethanol for 1 week, and then rehydrated in phosphate buffer.