
FIGURE 1—
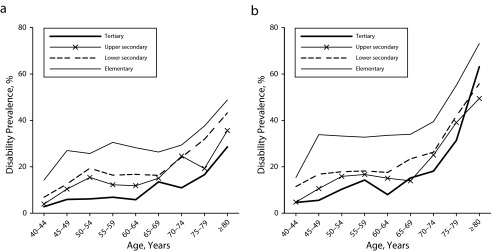
Prevalence of disability according to age groups and level of education for (a) men and (b) women: pooled from the Dutch Permanent Survey of Living Conditions, 2001–2007.
Note. The sample size was n = 24 883.
Official websites use .gov
A
.gov website belongs to an official
government organization in the United States.
Secure .gov websites use HTTPS
A lock (
) or https:// means you've safely
connected to the .gov website. Share sensitive
information only on official, secure websites.
Prevalence of disability according to age groups and level of education for (a) men and (b) women: pooled from the Dutch Permanent Survey of Living Conditions, 2001–2007.
Note. The sample size was n = 24 883.