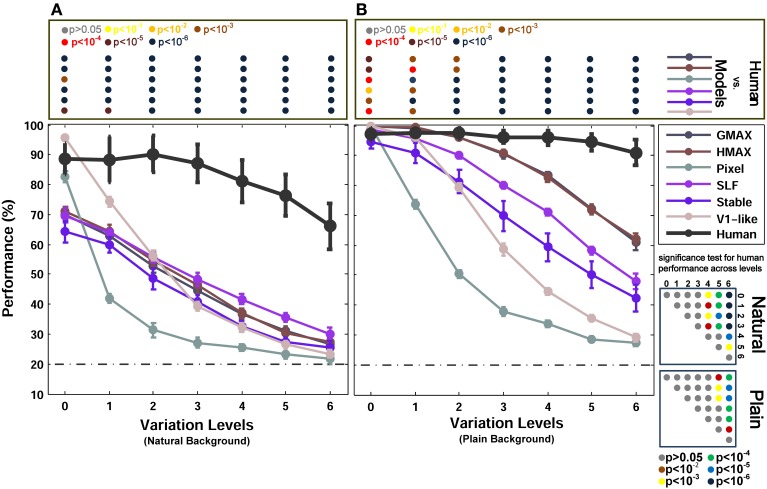
Figure 6.
Performance comparisons between different models and human in multiclass invariant object categorization task. (A) Performance comparison when objects were presented on natural backgrounds. The dashed, horizontal line shows the chance level (20%) and each curve represents the performance of a model in different levels of variation, specified with different colors in the top right inset. The bold black curve illustrates human performance. The color-coded circle points at the top of each plot, inside the rectangular box, exhibits the p-values for comparisons between human and each of the models obtained by Wilcoxon signed-rank test. The color-coded circle points at the right insets, inside the square boxes, show the p-values for all possible comparisons for human responses in different levels of variation (with plain and natural background). Here, the p-values show whether human categorization performances are significantly different at different levels of variation. For example, we compared the performance of human in Level 0, with Level 1, Level 2, and so on and reported a p-value for each comparison. These comparisons resulted in a symmetric p-value matrix with the size of 7*7 (i.e., 7 levels of variations). (B) Performance comparisons when objects were presented on plain backgrounds. In both panels (A,B) error bars are STD and the performances are the average of 15 runs.

